The current macro environment across global equity markets presents a sharply divided investment setup for 2024 and the remainder of the decade. While our concerns are fueled by the pervasive speculation in the US stock market, there also exists a parallel narrative where long-neglected economies present themselves with exceptional value and promising growth opportunities.
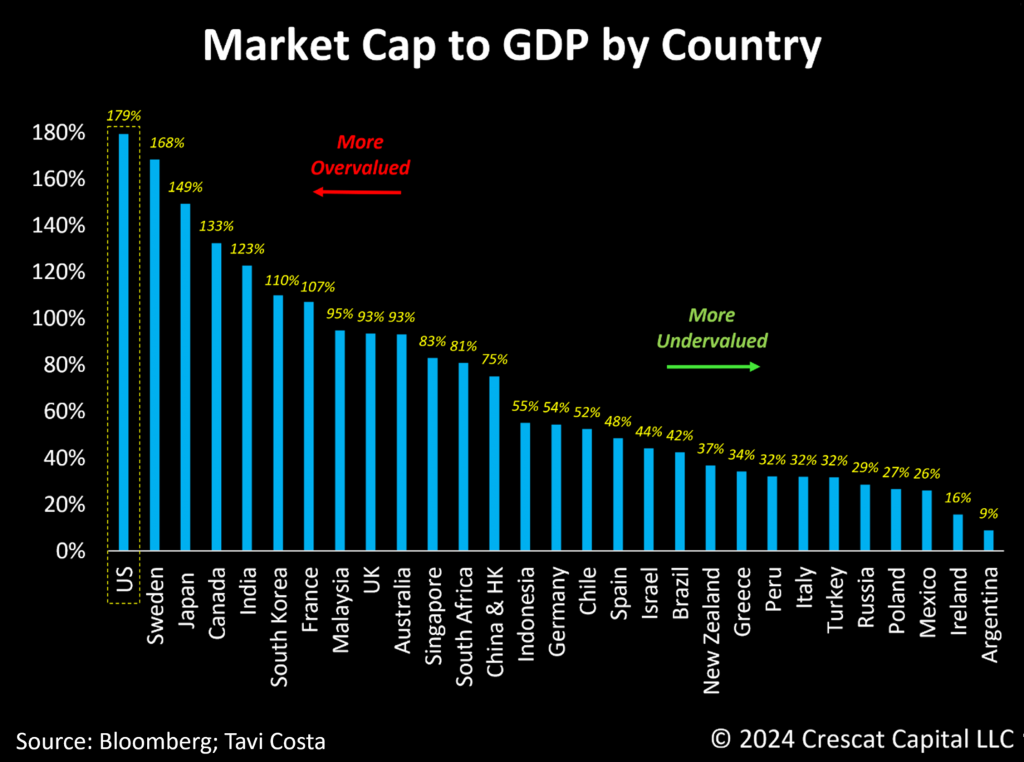
Utilizing Warren Buffett’s preferred valuation indicator, it becomes unmistakable that US stocks not only sit at historically expensive levels but also are the most overvalued among 28 of the world’s largest economies. In our strong view, investors buying US equities are currently undertaking unjustified risks amid dangerously inflated valuations.
Equally relevant, but on the positive side, observe the prevalence of economies with notably low valuations that also possess substantial exposure to broad commodities that have a favorable supply and demand outlook. South America, in this context, stands out as a resource-rich region with incredibly undervalued markets, especially when juxtaposed with the US.
We would much rather own growing businesses at low single-digit P/E multiples than hyped-up US mega-cap technology stocks, such as the Magnificent 7, which at the mean are trading at an exuberant 48 times annual trailing profits with questionable potential to sustain their past growth rates.
The AI Paradox
Today’s stark divergence in valuation metrics globally highlights the potential for investors to uncover compelling opportunities in undervalued regions and industries. This challenges the prevailing trend characterized by crowded optimism in US technology companies, which presently constitute more than one-third of the overall equity market – an extent of dominance not seen since the peak of the tech bubble.
More interestingly, the recent advancements in artificial intelligence could paradoxically have highly positive implications for emerging markets that have long grappled with a low-quality labor force.
Examining the evolution of entrepreneurship, the internet has enabled individuals to start businesses without the need for a physical location, significantly lowering barriers to entry for new enterprises. Tools like ChatGPT, even in their early stages, act as true capability enablers. Now, individuals can not only launch businesses from their dorm rooms but also access high-quality personal assistants, programmers, mathematicians, writers, historians, biologists, and more at virtually no cost.
When extrapolating this phenomenon globally, less developed economies gain access to the same tools, leveling the playing field in terms of labor quality. The United States has historically benefited tremendously from having top-tier school systems and attracting students and workers from around the world. However, these transformative changes suggest that the gap in company valuations between developed and less developed economies will likely shrink significantly. The market, in our view, is underestimating these changes, especially at a time when the valuation of a US company has never been more expensive relative to an emerging market.
This idea can be extended further to posit that these new tools generate highly innovative and disruptive technologies that will also narrow the valuation gap between larger and smaller companies. Concurrently, today’s market exhibits an unprecedented level of dominance by mega-cap technology stocks, which in our view is completely unsustainable.
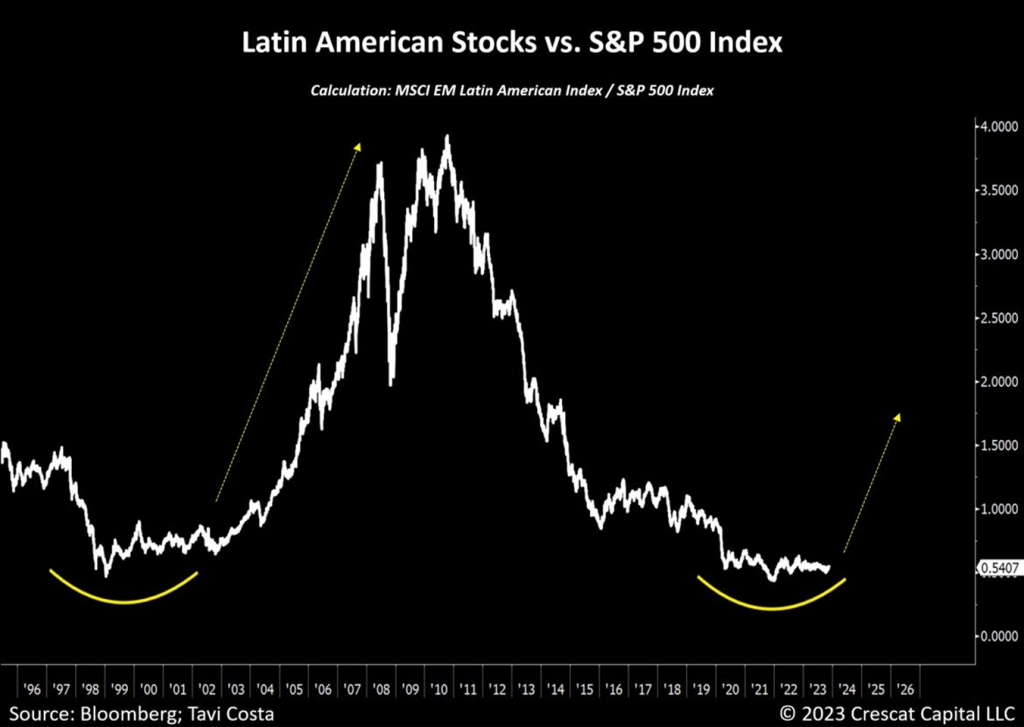
An alternative representation of the opportunity to buy undervalued Latin American businesses and short overpriced US stocks is depicted in this chart. The relative performance between these two regions is currently re-testing the levels we experienced in the early 2000s, a time that marked a major bottom for emerging versus developed markets. We believe the current investment landscape is remarkably similar to that period, and potentially even more compelling now.
Given our conviction in this thesis, our Global Macro Fund currently has a 37% weight in South American companies, mostly through mining businesses. Furthermore, we pair that exposure with a substantial short position in US markets through a diversified basket of thematic ideas: mega-cap growth ceiling, ESG re-think, private equity mismatch, and mispriced cost of capital. These are all research-driven themes that are strongly supported by our fundamental quant models.
A New Investment Cycle
We believe that November 2021 marked the beginning of a new investment cycle, characterized by a critical shift in market correlations across different asset classes. During this period, businesses operating at unsustainable valuations faced a moment of reckoning, and the global fixed-income market underwent a complete collapse. Safe-haven currencies, such as the Japanese Yen, notably faltered. Additionally, the transition from growth to value stocks was initiated, benefiting commodity-related firms, while resource-rich emerging markets notably outperformed their developed counterparts. Outside of mega-cap technology companies, these market trends have persisted and are likely to intensify in the years ahead.
The next decade is likely to be influenced by a set of significant factors. These include the deepening challenges associated with deglobalization, a critical shift for businesses to prioritize securing their logistics rather than focusing solely on cost-efficiency, rising social and political pressure favoring populist leaders in response to widespread global wealth disparities, anticipated widespread labor strikes as workers seek better compensation in light of corporate profits, and forthcoming issues arising from a prolonged period of underinvestment in natural resource industries that is yet to impact the supply of critical materials.
The convergence of these long-term macro trends is profound and leads us to anticipate that inflation will surpass its historical averages over the last 30 years. Consequently, we expect the cost of capital to rise significantly and sustainably in the decade ahead. The potential for such an environment sets the stage for profound changes in the price behavior of financial markets. As the overall cost of issuing debt and equity becomes more cumbersome, it is highly improbable that volatility will remain as subdued as it currently is. As a result, we believe a return to a more disciplined approach is inevitable, prompting companies to shift their focus back towards profitability. With these shifts unfolding, investors are likely to reward improvements in the bottom line, leading to a resurgence of fundamental-driven analysis.
Similar to the preceding 30 years, these changes are not expected to be permanent; they are merely part of the cyclical nature inherent in long-term investment cycles. We believe that this evolving environment will present incredible opportunities, and the market behavior observed from November 2021 to the end of 2022 is more likely to replicate itself than to be characterized by trends similar to those experienced in 2023.
As central banks become politically constrained due to the exponential growth in overall debt, these institutions are likely to be compelled to use monetary policy as a funding mechanism to ensure the financial stability of their respective government securities markets. Consequently, even more meaningfully than in prior decades, the debasement of fiat currencies will probably be an important macro theme worldwide as a hard asset cycle is unleashed, particularly on a relative basis compared to historically expensive financial assets.
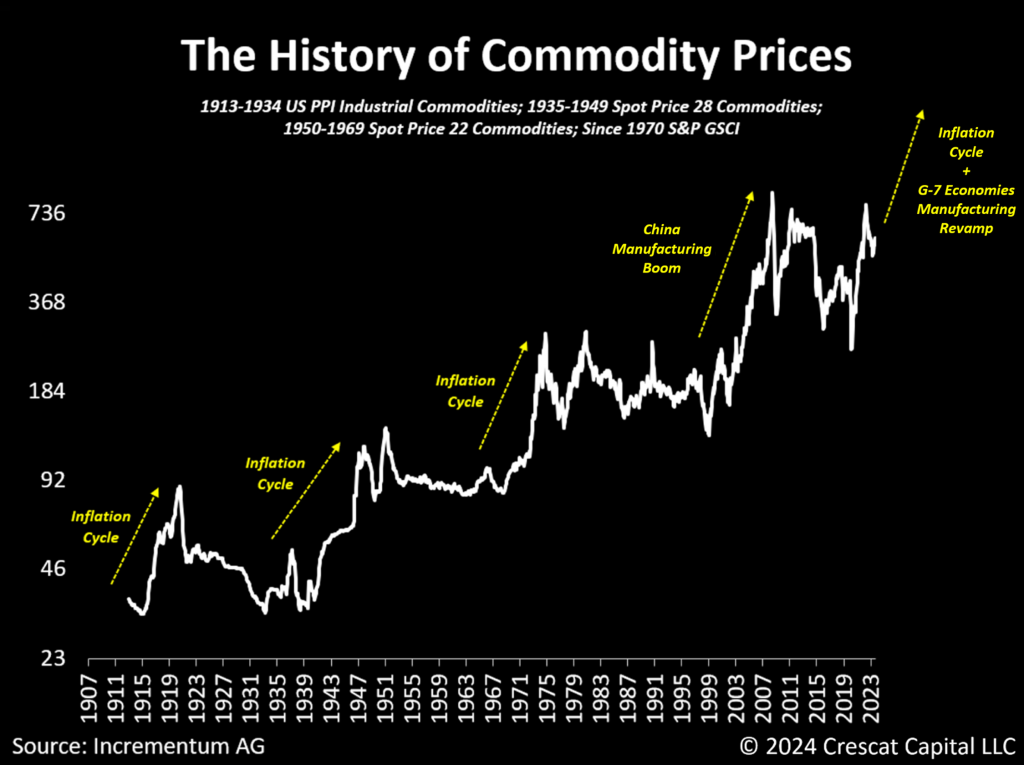
Courtesy of our friends at Incrementum AG, the following chart gives us an insightful historical perspective. Since the 1900s, we have had four notable commodity cycles. Three of them occurred during inflationary periods: the 1910s, 1940s, and 1970s. The fourth cycle took place in the early 2000s, coinciding with China’s entry into the World Trade Organization and its emergence as the manufacturing hub of the global economy, leading to one of the most extensive construction booms in history. Now, we believe we are standing on the cusp of witnessing two macro tailwinds favoring commodities at once:
- The likely onset of another long-term inflationary cycle;
- A global manufacturing ramp in G-7 economies
In our view, another commodity cycle is underway.
A Second Wave of Inflation in Progress
The Fed wants you to know that the fight against inflation is over because the economy cannot sustainably endure this level of cost of debt. However, in our strong view, the inflation genie is out of the bottle and a second wave is likely in progress.
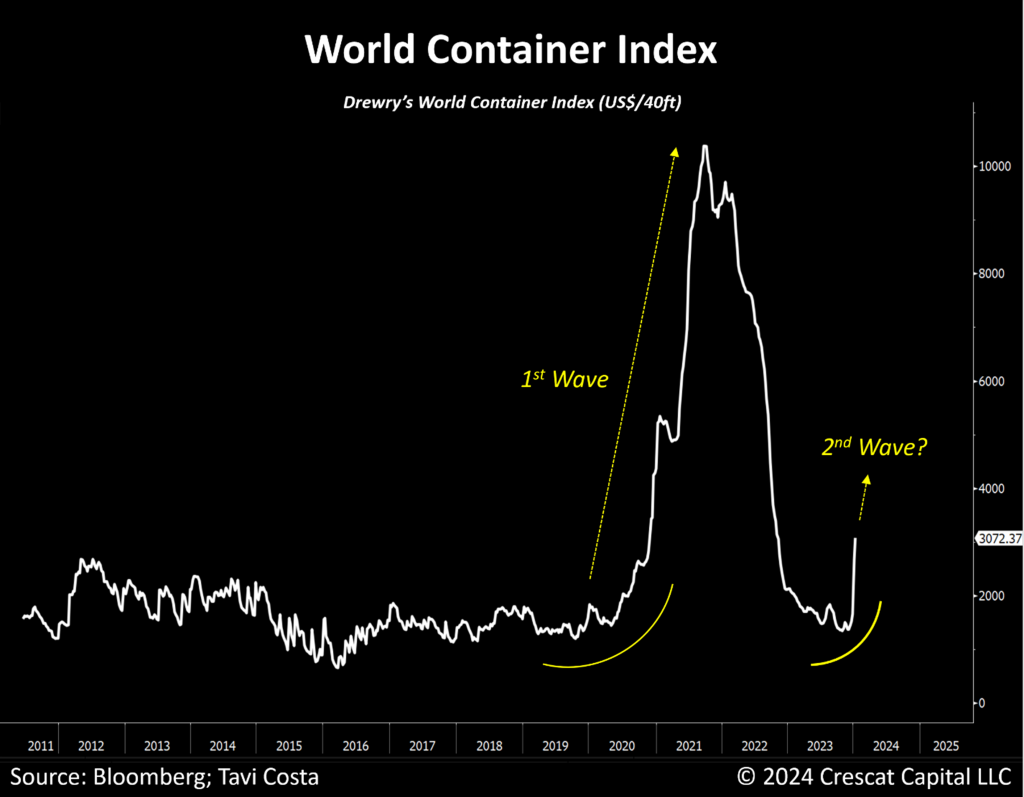
We’ve observed a substantial 61% surge in the global freight rate for containers over the past week. The primary catalyst behind this increase is attributed to geopolitical conflicts in the Red Sea region.
Contrary to some analysts who perceive these recent deglobalization trends as isolated occurrences, we contend that they are interconnected in a meaningful way. This interconnection introduces a substantial level of complexity to the logistics of goods and services, and we anticipate that it will continue to exert upward pressure on consumer prices over time.
A Steepening of the Yield Curve Likely Ahead
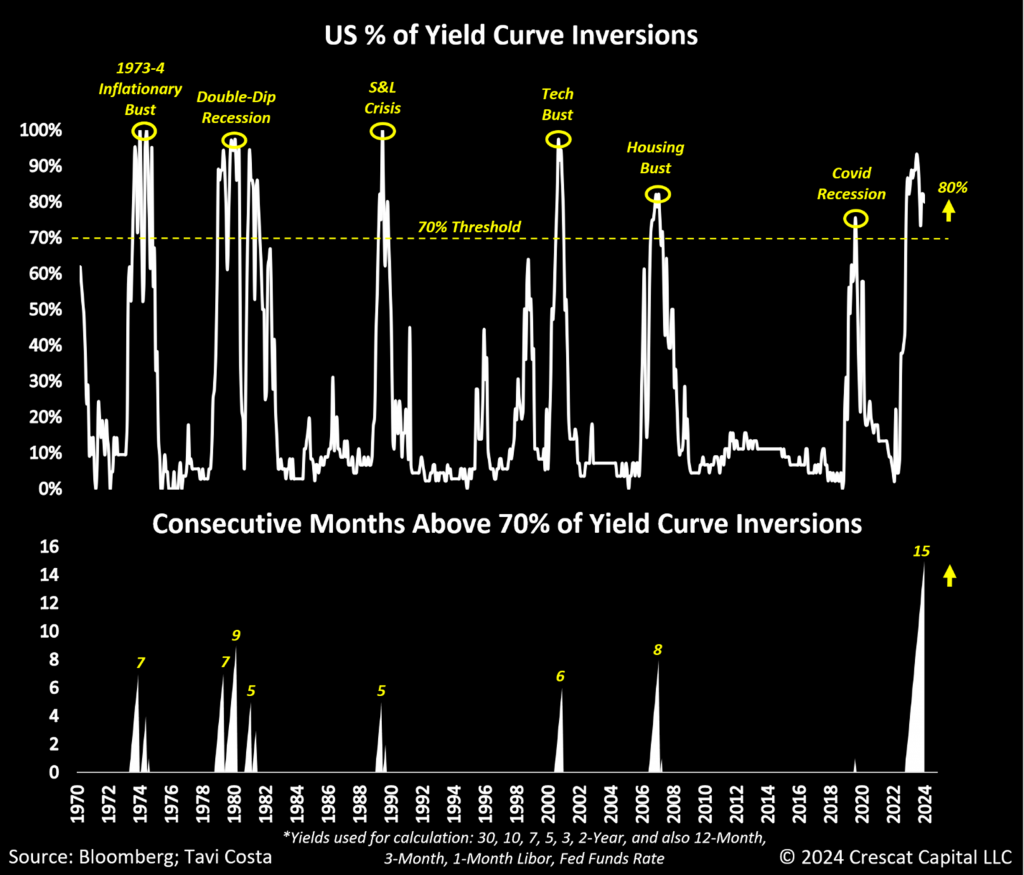
Today, by far, is the longest period in history that the percentage of yield curve inversions in the US Treasury market has stayed above the recessionary threshold of 70% for 15 consecutive months based on our proprietary model which we show in the chart below. While the actual level of deeply inverted interest rate spreads is concerning, it is evident to us that after reaching such extreme levels, the yield curve tends to steepen abruptly as an economic downturn unfolds.
Following one of the most robust 2-month declines in 10-year yield interest rates, which we perceive as an unsustainable move, we anticipate a significant de-inversion of short versus long-term rates as economic growth faces major challenges.
Furthermore, the global Purchasing Managers’ Index (PMI) has remained below its critical 50 level for 16 consecutive months. This prolonged dip is a compelling reason behind the worldwide trend of central banks shifting to a less hawkish policy stance. Interestingly, more monetary authorities are lowering interest rates than raising them. The global economy, burdened by heavy debt, cannot sustain a consistently elevated cost of capital environment. These factors collectively suggest a complex economic landscape with simultaneous recessionary and inflationary risks.
A Lack of Market Breadth
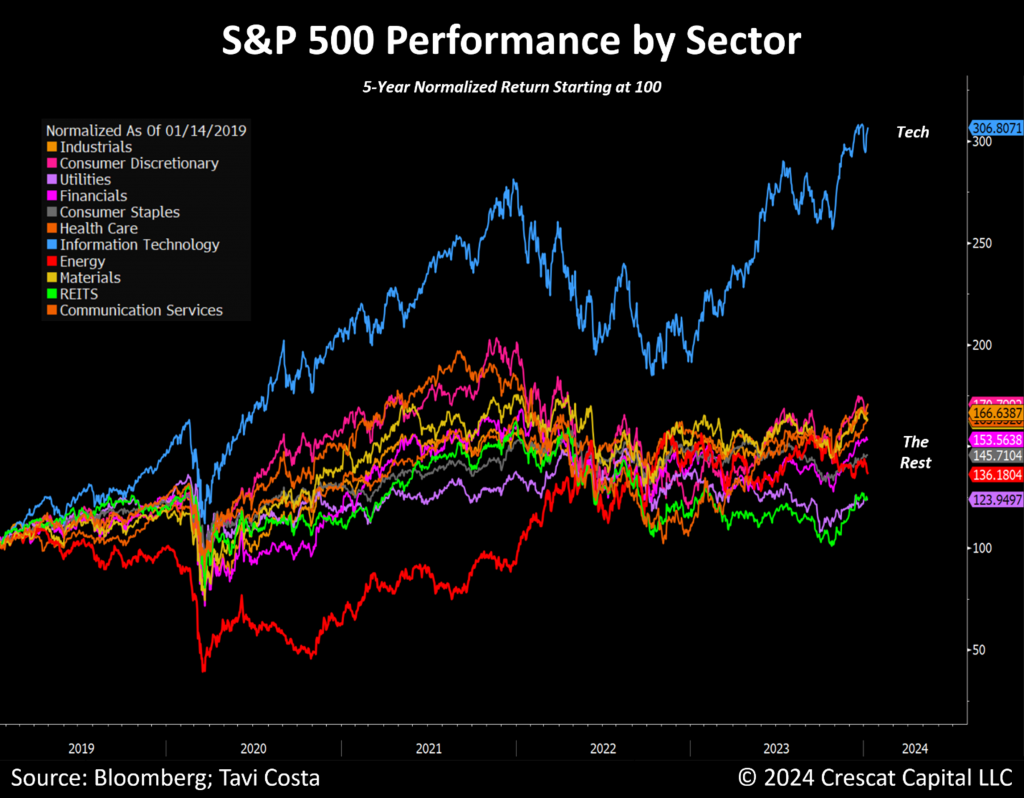
The S&P 500 is currently re-testing its prior closing high from January 4, 2022, but the breadth of leadership is suspiciously narrow as it is completely dominated by richly valued mega-cap tech companies, similar to the tech bubble in the early 2000s.
Reviewing the performance of the last five years makes it clear where investors have predominantly directed their focus. Undoubtedly, the technology sector has garnered the majority of capital flows and attention. As is often the case, strategies that proved successful in the previous cycle are likely to face challenges in the upcoming one. We expect that businesses engaged in the production of hard assets, i.e. commodities, will become the market leaders of the next decade.
The current market structure reminds us of the final stages of the tech bubble. During that period, the S&P 500 reached its peak on March 24, 2000, subsequently retesting the same level on September 1, ultimately forming a double top that only concluded after a 50% decline in the overall market. Notably, tech companies experienced an 83% plunge from peak to trough.
Deteriorating Growth Outlook for the Tech Giants
The largest technology firms are priced for future growth that is higher than the economy at large, a feat that will be nearly impossible to deliver. The problem is that collectively the revenues, earnings, and free cash flows generated by these businesses, including the Magnificent 7, have become so big already that these companies ARE the economy. Thus, not only can they not grow any faster than the broad economy, but they are inextricably tied to it, including to the inevitability of the business cycle, i.e., recessions. In addition, the current market share and outsized profit margins of these elephants are the targets of competitors and regulators seeking to break down their monopolistic advantages.
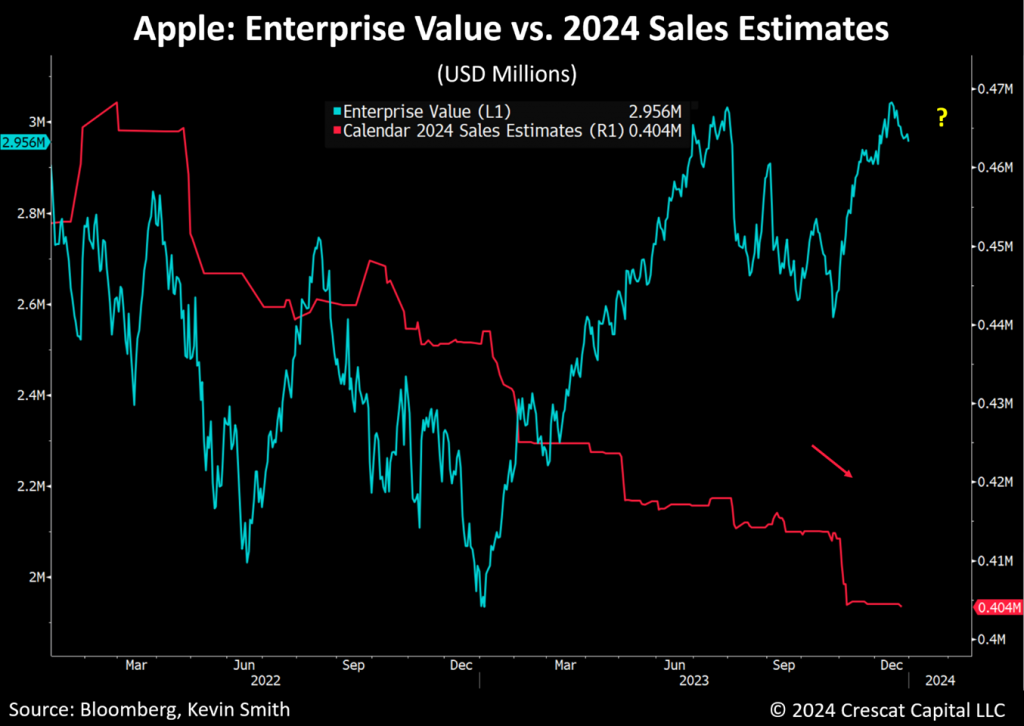
Note that Apple’s sales estimates for 2024 have been coming down steadily for two years according to the median among Wall Street analysts. Apple has ceased its ability to grow its top line for four quarters in a row already and appears poised to report another lackluster growth quarter for its calendar year-end. At a 7.3 EV-to-sales multiple, this stock is highly overvalued in our model and presents significant downside risk.
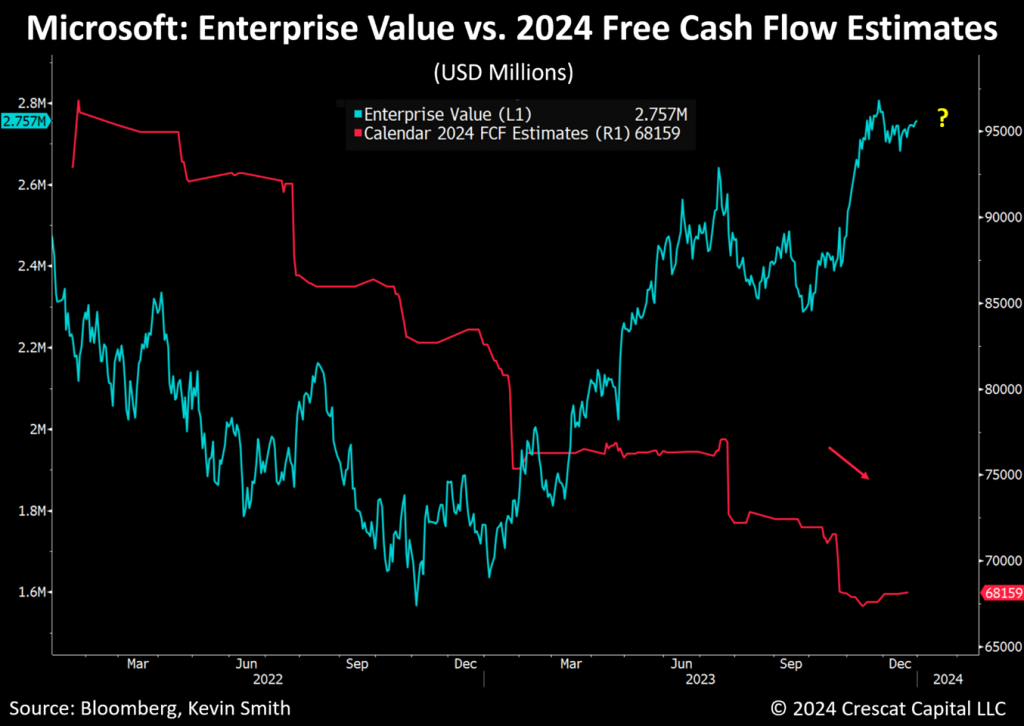
At Microsoft, artificial intelligence looks like a CAPEX spending black hole. Competing with Amazon in the data center for ultimate free cash flow growth and profitability will be difficult. At 40 times 2024 FCF estimates, we think Microsoft investors are making a big bet on high future growth with no margin of safety.
The promise of artificial intelligence is fueling a renewed hype in big tech company valuations, but just like the promise of the Internet in the early 2000s compared to the exuberance in valuations of large-cap tech stocks at that time, we believe the enthusiasm today has gotten way ahead of the reality. The hope for long-term economic growth and prosperity from advances in artificial intelligence is legitimate, but the investment opportunities in today’s megacaps are dubious given their high valuations. We believe superior investment prospects will arise from companies not yet globally recognized, rather than relying on mature past winners, and that there will be a much better time to allocate capital to technology stocks after a likely coming valuation reckoning and ensuing economic recession. We welcome such creative destruction in the ultimate pursuit of societal and investment gains from artificial intelligence.
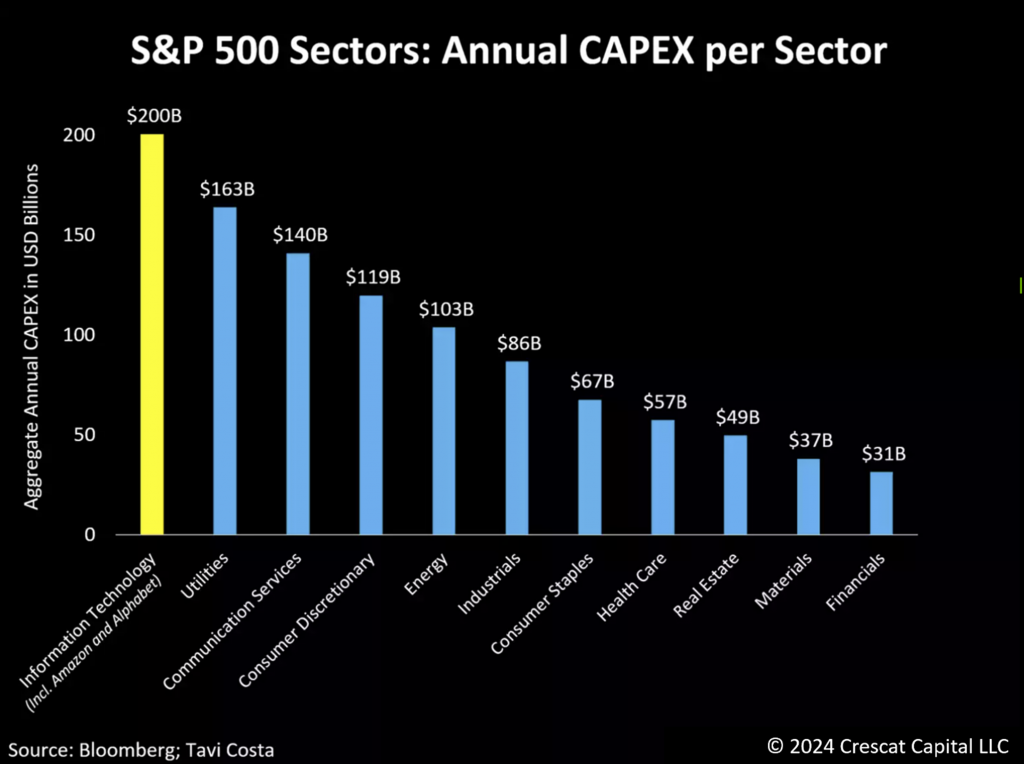
Tech: The Most Capital-Intensive Sector of the Economy Today
While it has been relatively unnoticed, US companies have recently engaged in one of the most extensive capital spending booms in history. Conventional wisdom would think that most of these corporate investments in the economy are currently being driven by highly capital-intensive businesses, but the truth is that technology businesses have been by far the biggest contributor to this investment expansion. Megacap technology companies currently carry most of the weight in the economy and have been prominent players in the capital expenditure witnessed over the past 12 months. Nonetheless, their growth potential is nearing a point of exhaustion, making it increasingly crucial for them to reinvent themselves and explore alternative avenues to expand their businesses. However, the challenge lies in the fact that, despite investing billions of dollars in artificial intelligence (AI), the future return on this investment remains highly uncertain.
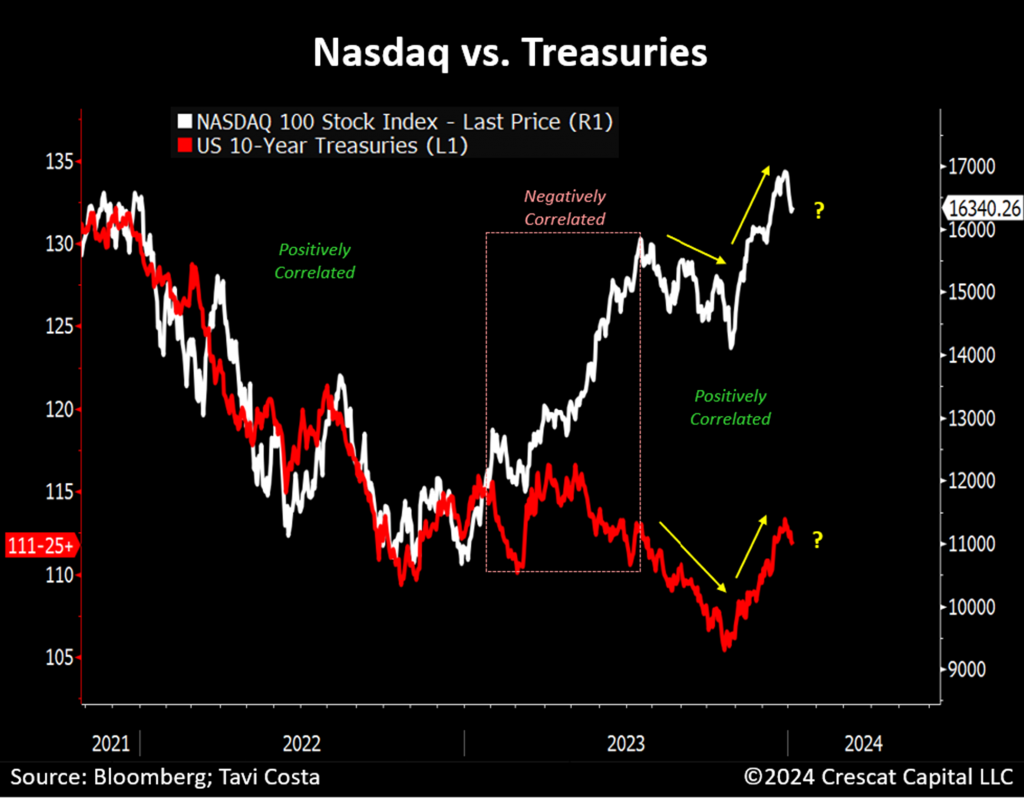
Interest Rates & Stocks Moving in Tandem
From November 2021 to 2022, there was a noticeable positive correlation between Nasdaq stocks and Treasuries. However, during a brief period around the ChatGPT release and the AI craze, these two markets moved in opposite directions for approximately 6 months. Since mid-2023, the correlation between Nasdaq and Treasuries has returned to the synchronicity observed in 2022. The recent decline in interest rates is seen as a significant factor contributing to the rally in US equities.
We anticipate that inflation will re-emerge as the government grapples with a severe deficit funding problem, and there will be further upward pressure on long-term yields, likely impacting US stocks in 2024. It is crucial to note that an unprecedented $8.2 trillion of outstanding Treasuries will need to be re-issued in the next 12 months based on our analysis.
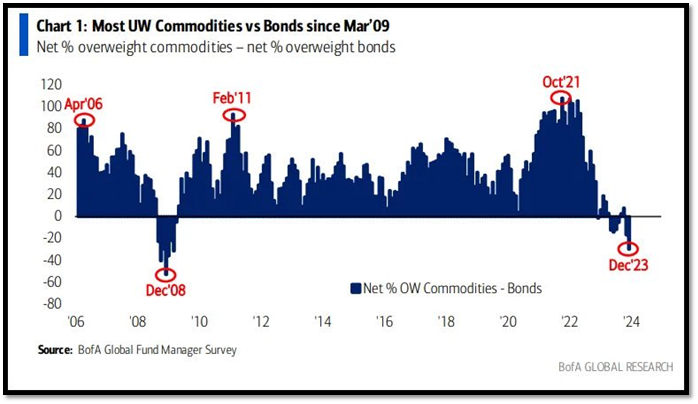
Bonds: Historically Crowded
This chart produced by the Bank of America Global Research team is probably one of the most important research pieces we have seen in the last several weeks.
Commodities have been the most underweight relative to bonds since March 2009. It underscores the historical extremity in the valuation disparity between hard assets and financial ones. The shift back to resource industries may catch many investors off guard as valuations in crowded sectors compress. It’s worth a reminder that three out of the last four commodity cycles in the past 130 years coincided with inflationary periods as we showed further above.
Against the backdrop of rising geopolitical conflict, high fiscal deficits, and labor cost pressures, a broad increase in commodity prices would only add more fuel to the inflation fire.
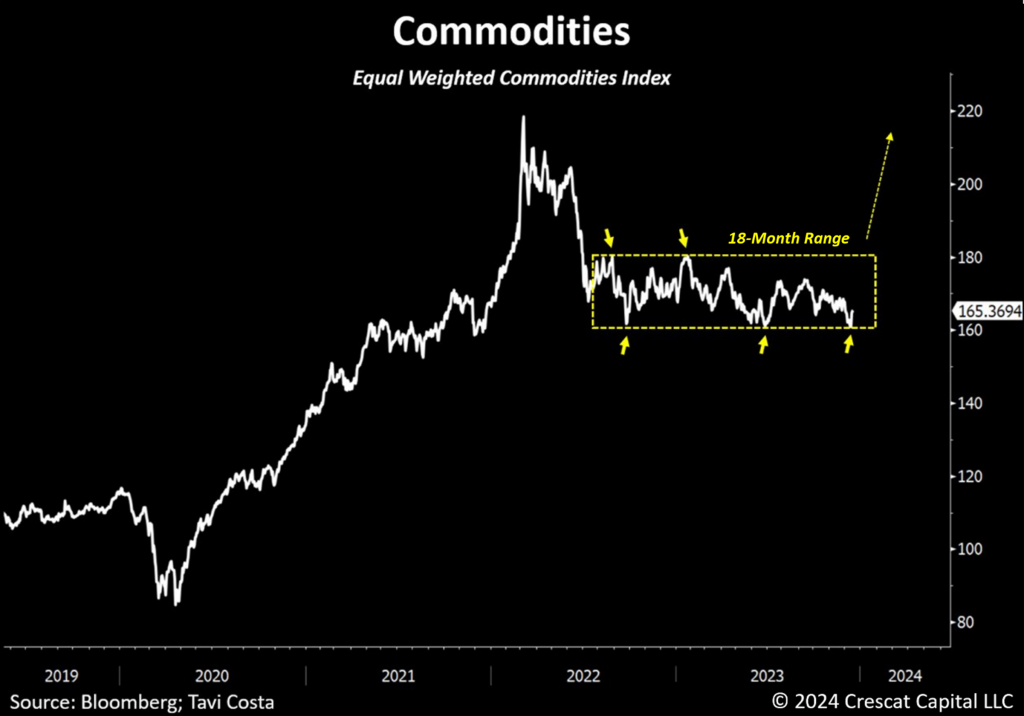
Breaking Out from an 18-Month Range
Commodities have been trading within a narrow horizontal channel for more than 18 months. Whenever we’ve approached the lower end of this range, it has consistently signaled excellent buying opportunities, and that is where we are today.
Given the Fed’s apparent complacency towards inflation, we believe commodity prices are likely to break out of this range and revisit the Russian invasion highs from 2022.
As a main component of the hard assets’ realm, commodities are historically undervalued and poised to move significantly higher in the coming years. This trend should be further boosted by the conservative approach of resource producers, who continue to underinvest in new projects, thereby ensuring a tight supply environment for the long term.
The Consensus View Is Almost Always Wrong
Should the analysis outlined above be validated, and there is a notable upward surge in natural resource prices, it seems that a large majority of Wall Street analysts who are strongly anticipating lower inflation for 2024 may be setting themselves up for a major disappointment.
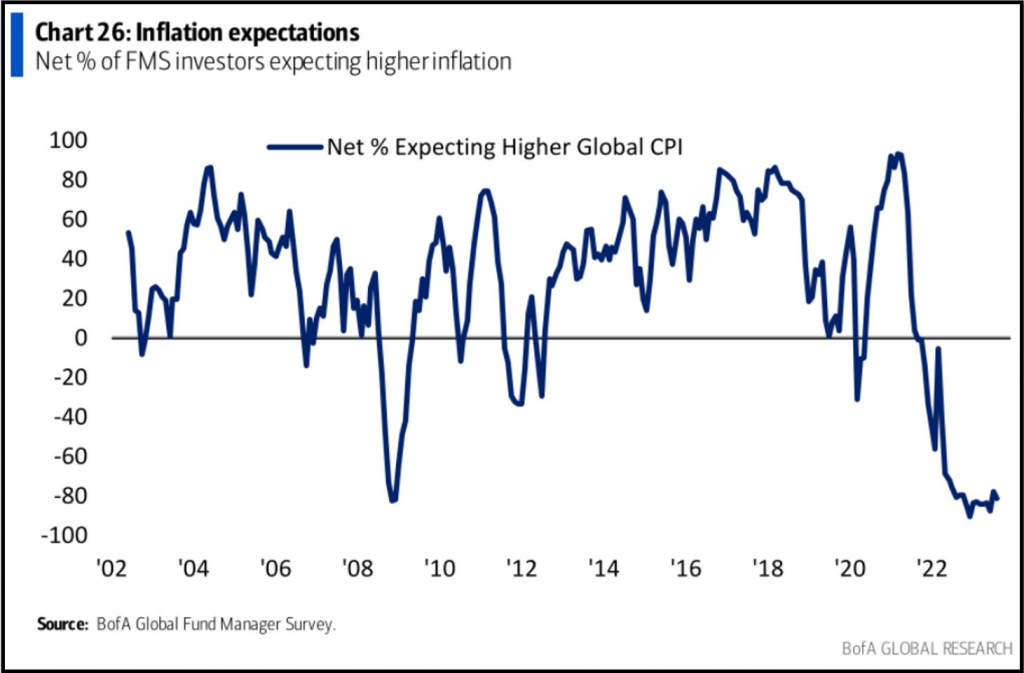
As shown in the chart below, investors expecting global inflation to decelerate is the most consensus view in the history of the data, even lower than during the Global Financial Crisis. This is consistent with how market participants are the most bullish on long-term Treasuries they have ever been, as indicated by the Bank of America Global Fund Manager Survey.
Crowded market views are often wrong and the current inflationary forces appear to have a significant underlying structural foundation.
An Allocation Shift Towards Gold
From our perspective, precious metals and mining companies remain among the most appealing investment opportunities, with gold poised for a significant breakout that could signal the initiation of a new long-term cycle. There is nothing more bullish for precious metals than being forced to restore financial repression in a highly inflationary environment. Interestingly, for the first time since 2021, central banks worldwide are implementing more rate cuts than hikes.
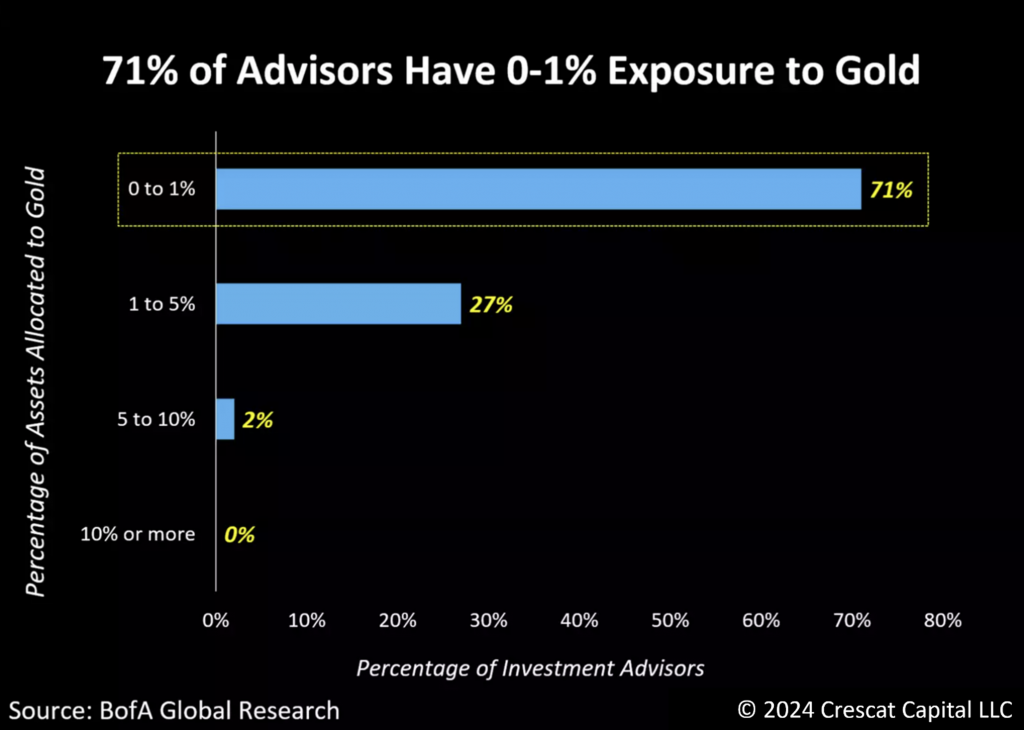
The macro reasons for owning gold are undeniably strong, and what further reinforces our confidence is the increasing neglect of the metal as a defensive alternative over the past decade. This is evident in the significant underrepresentation of precious metals among traditional investment strategists. According to Bank of America, 71% of wealth advisors hold 0-1% of gold in their portfolios today.
What stands out to us even more from the data below is the notable absence of any investors who own 10% or more of the metal— to say the least, a striking observation.
A Distressed Opportunity
With gold setting the stage for a significant move, 2024 is likely to be the year for precious metals. Investors remain gun-shy about deploying capital into the mining industry, which we believe will be one of the best segments of the market in the coming year.
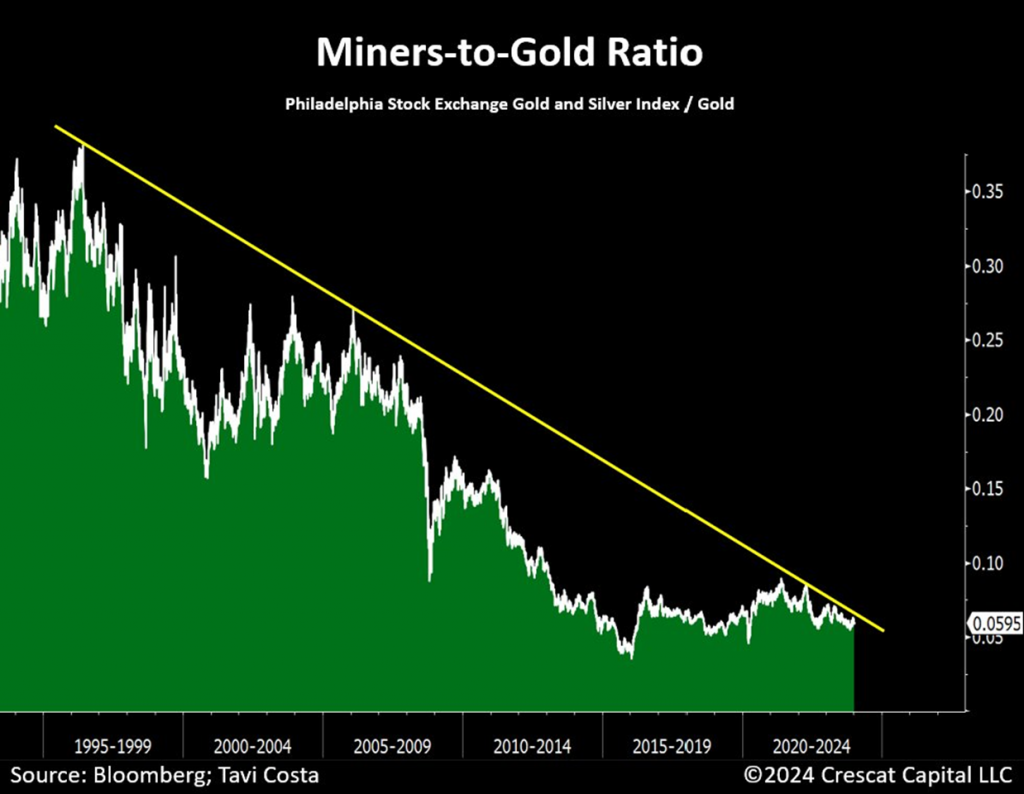
It’s remarkable how mining stocks continue to be highly resilient despite the weakness in gold prices today. The valuations for these companies couldn’t be more distressed, and we are likely near a major bottom.
Miners: The Take-Off Phase
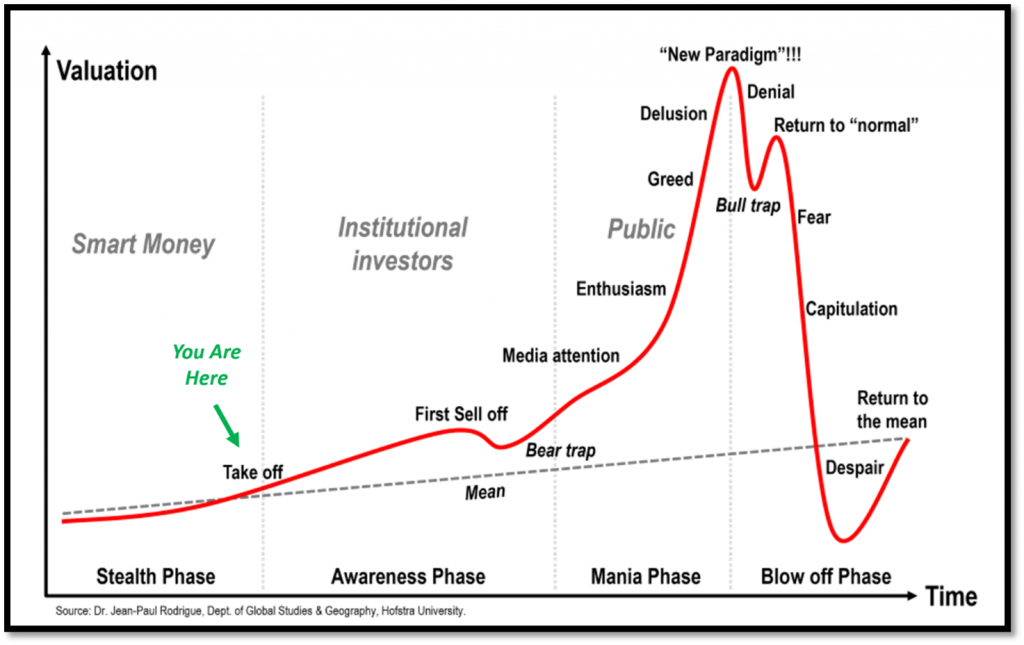
The metals and mining industry looks to be entering the take-off phase. The M&A cycle is heating up, institutional capital is starting to deploy capital, central banks buying record amounts of gold, and precious metals are now on the verge of a major breakout. A long-awaited bull market for mining companies is likely getting started.
We view the chart below as a template to idealize what is yet to come for mining companies if this is indeed the beginning of a new gold cycle, as we strongly believe it is.
The High-Beta Version of Gold
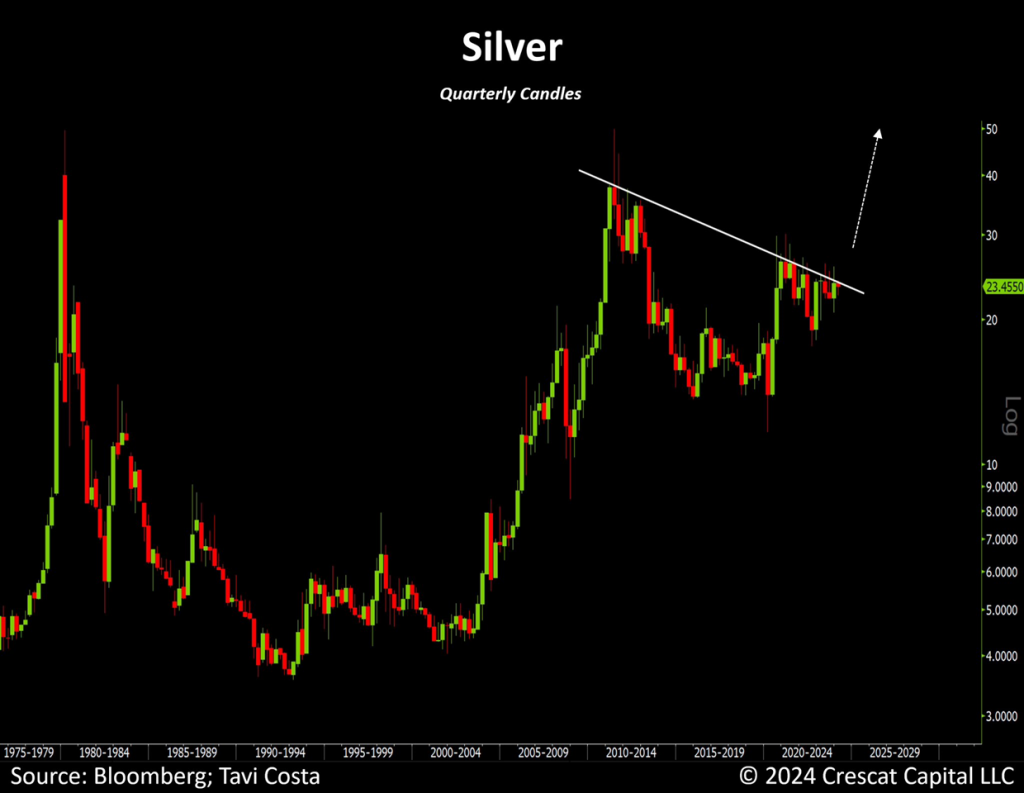
Silver, teetering on the brink of a historic breakthrough, has everything to become one of the standout performers in 2024.
This chart stands out as one of the most bullish setups for the next 5 to 10 years. The inevitable breakout from this historical resistance is the primary reason for our strategic focus on deploying capital efficiently into high-quality projects with substantial exposure to silver.
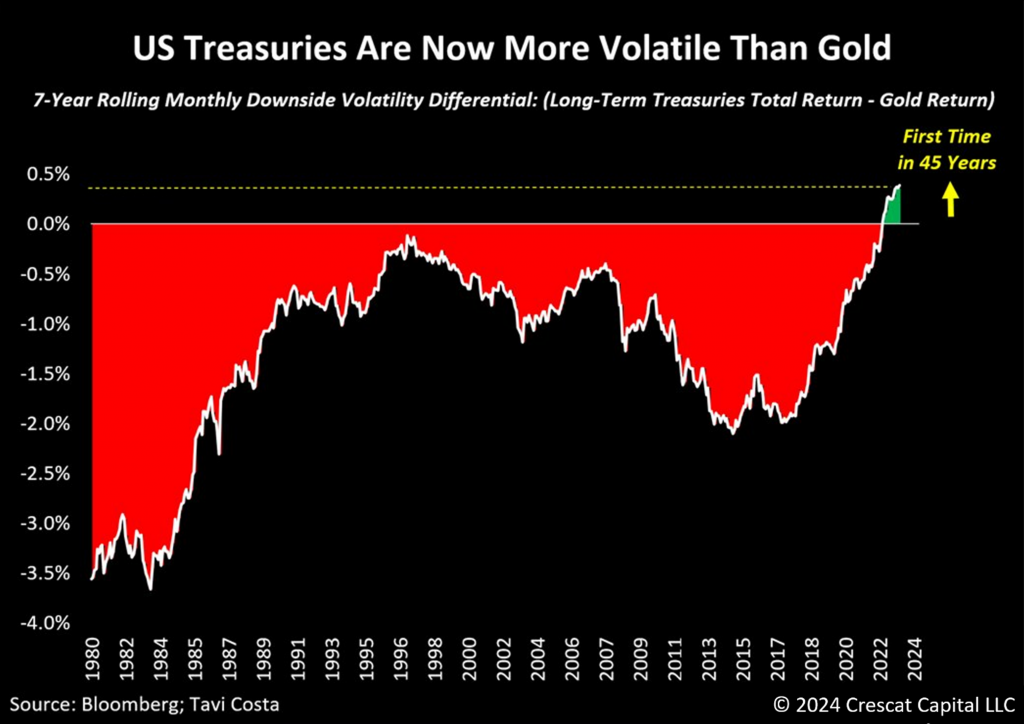
Treasuries More Volatile Than Gold
Looking back at 2023, this is among the most relevant charts for investors to navigate the next investment cycle. It is undeniably crucial to understand that Treasuries are no longer the safest alternative. In fact, for the first time in 45 years, US Treasuries now have higher downside volatility than gold.
The shifting dynamics of capital moving away from crowded equity and fixed-income holdings, as investors seek new investment opportunities, could have profound implications in financial markets. This is where gold, commodities, and overall hard assets are poised to play a significant role during this transitional phase from traditional 60/40 portfolios.
2024 Outlook
We are extremely excited about the opportunities to deliver strong performance for our clients across Crescat’s strategies in 2024 and beyond. 2023 was a challenging year for shorting overvalued companies in our Global Marco and Long/Short funds because they only become more overvalued. We anticipate much vindication on that front in 2024. Meanwhile, our activist metals long strategy remains the most compelling investment endeavor that the principals of the firm have been involved with in our careers, and we are committed to continuing to deliver outsized returns from that theme to our loyal long-term clients in the years ahead.
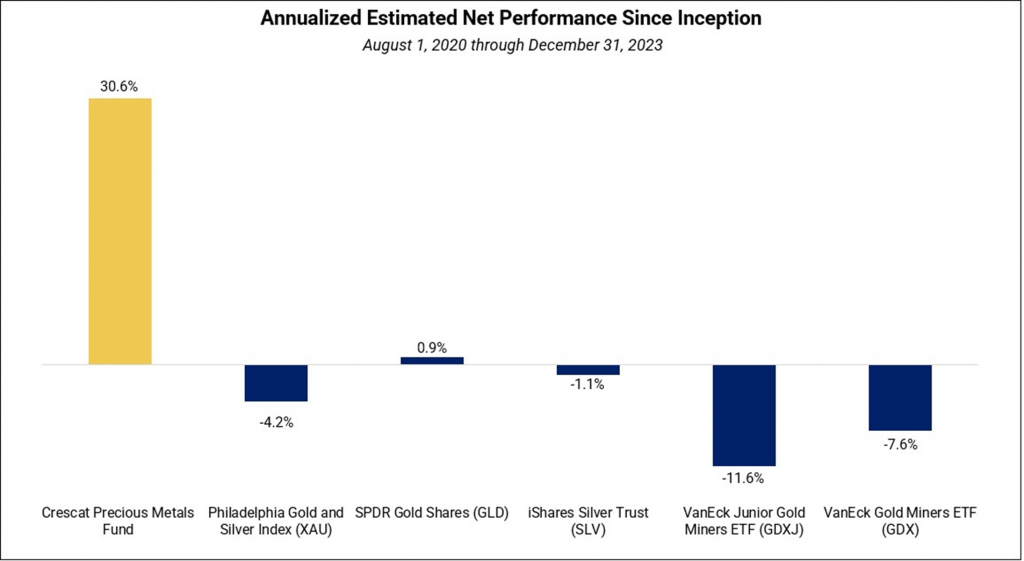
Precious Metals Fund Performance Since Inception Vs. Benchmarks
Performance of Crescat Strategies Since Inception
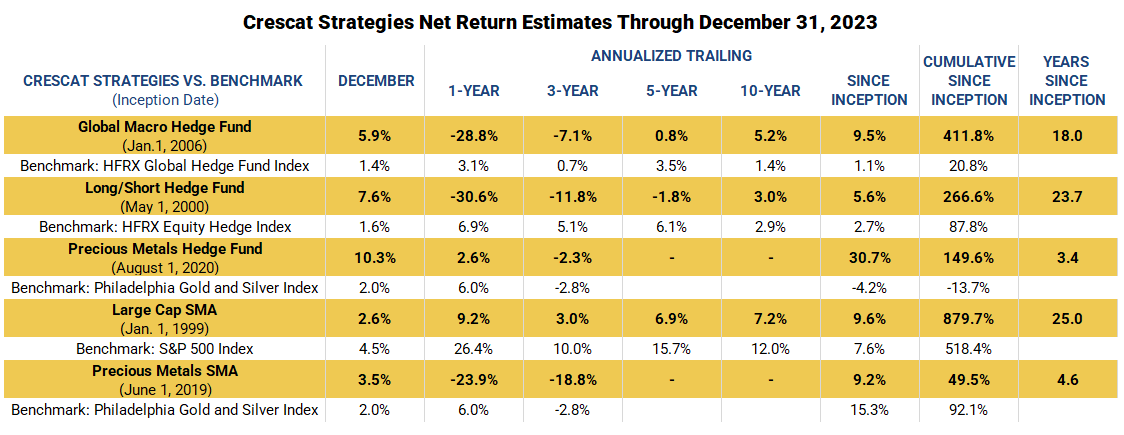
Performance data represents past performance, and past performance does not guarantee future results. Performance data is subject to revision following each monthly reconciliation and/or annual audit. Historical net returns reflect the performance of an investor who invested from inception and is eligible to participate in new issues. Net returns reflect the reinvestment of dividends and earnings and the deduction of all fees and expenses (including a management fee and incentive allocation, where applicable). Individual performance may be lower or higher than the performance data presented. The performance of Crescat’s private funds may not be directly comparable to the performance of other private or registered funds. The currency used to express performance is U.S. dollars. Investors may obtain the most current performance data and private offering memorandum for Crescat’s private funds by emailing a request to info@crescat.net.
We encourage you to reach out to any of us listed below if you would like to learn more about how our vehicles might fit with your individual needs and objectives.
Sincerely,
Kevin C. Smith, CFA
Founding Member & Chief Investment Officer
Tavi Costa
Member & Macro Strategist
Quinton T. Hennigh, PhD
Member & Geologic and Technical Director
For more information including how to invest, please contact:
Marek Iwahashi
Investor Relations Coordinator
(720) 323-2995
Linda Carleu Smith, CPA
Co-Founding Member & Chief Operating Officer
(303) 228-7371
© 2024 Crescat Capital LLC
Important Disclosures
Performance data represents past performance, and past performance does not guarantee future results. An individual investor’s results may vary due to the timing of capital transactions. Performance for all strategies is expressed in U.S. dollars. Cash returns are included in the total account and are not detailed separately. Investment results shown are for taxable and tax-exempt clients and include the reinvestment of dividends, interest, capital gains, and other earnings. Any possible tax liabilities incurred by the taxable accounts have not been reflected in the net performance. Performance is compared to an index, however, the volatility of an index varies greatly and investments cannot be made directly in an index. Market conditions vary from year to year and can result in a decline in market value due to material market or economic conditions. There should be no expectation that any strategy will be profitable or provide a specified return. Case studies are included for informational purposes only and are provided as a general overview of our general investment process, and not as indicative of any investment experience. There is no guarantee that the case studies discussed here are completely representative of our strategies or of the entirety of our investments, and we reserve the right to use or modify some or all of the methodologies mentioned herein.
This presentation is not an offer to sell securities of any investment fund or a solicitation of offers to buy any such securities. Securities of a fund managed by Crescat may be offered to selected qualified investors only by means of a complete offering memorandum and related subscription materials which contain significant additional information about the terms of an investment in the Fund and which supersedes information herein in its entirety. Any decision to invest must be based solely upon the information set forth in the Offering Documents, regardless of any information investors may have been otherwise furnished, and should be made after reviewing such Offering Documents, conducting such investigations as the investor deems necessary and consulting the investor’s own investment, legal, accounting and tax advisors in order to make an independent determination of the suitability and consequences of an investment in the Fund.
Risks of Investment Securities: Diversity in holdings is an important aspect of risk management, and CPM works to maintain a variety of themes and equity types to capitalize on trends and abate risk. CPM invests in a wide range of securities depending on its strategies, as described above, including but not limited to long equities, short equities, mutual funds, ETFs, commodities, commodity futures contracts, currency futures contracts, fixed income futures contracts, private placements, precious metals, and options on equities, bonds and futures contracts. The investment portfolios advised or sub-advised by CPM are not guaranteed by any agency or program of the U.S. or any foreign government or by any other person or entity. The types of securities CPM buys and sells for clients could lose money over any timeframe. CPM’s investment strategies are intended primarily for long-term investors who hold their investments for substantial periods of time. Prospective clients and investors should consider their investment goals, time horizon, and risk tolerance before investing in CPM’s strategies and should not rely on CPM’s strategies as a complete investment program for all of their investable assets. Of note, in cases where CPM pursues an activist investment strategy by way of control or ownership, there may be additional restrictions on resale including, for example, volume limitations on shares sold. When CPM’s private investment funds or SMA strategies invest in the precious metals mining industry, there are particular risks related to changes in the price of gold, silver and platinum group metals. In addition, changing inflation expectations, currency fluctuations, speculation, and industrial, government and global consumer demand; disruptions in the supply chain; rising product and regulatory compliance costs; adverse effects from government and environmental regulation; world events and economic conditions; market, economic and political risks of the countries where precious metals companies are located or do business; thin capitalization and limited product lines, markets, financial resources or personnel; and the possible illiquidity of certain of the securities; each may adversely affect companies engaged in precious metals mining related businesses. Depending on market conditions, precious metals mining companies may dramatically outperform or underperform more traditional equity investments. In addition, as many of CPM’s positions in the precious metals mining industry are made through offshore private placements in reliance on exemption from SEC registration, there may be U.S. and foreign resale restrictions applicable to such securities, including but not limited to, minimum holding periods, which can result in discounts being applied to the valuation of such securities. In addition, the fair value of CPM’s positions in private placements cannot always be determined using readily observable inputs such as market prices, and therefore may require the use of unobservable inputs which can pose unique valuation risks. Furthermore, CPM’s private investment funds and SMA strategies may invest in stocks of companies with smaller market capitalizations. Small- and medium-capitalization companies may be of a less seasoned nature or have securities that may be traded in the over-the-counter market. These “secondary” securities 12 often involve significantly greater risks than the securities of larger, better-known companies. In addition to being subject to the general market risk that stock prices may decline over short or even extended periods, such companies may not be well-known to the investing public, may not have significant institutional ownership and may have cyclical, static or only moderate growth prospects. Additionally, stocks of such companies may be more volatile in price and have lower trading volumes than larger capitalized companies, which results in greater sensitivity of the market price to individual transactions. CPM has broad discretion to alter any of the SMA or private investment fund’s investment strategies without prior approval by, or notice to, CPM clients or fund investors, provided such changes are not material.
Benchmarks
HFRX GLOBAL HEDGE FUND INDEX. The HFRX Global Hedge Fund Index represents a broad universe of hedge funds with the capability to trade a range of asset classes and investment strategies across the global securities markets. The index is weighted based on the distribution of assets in the global hedge fund industry. It is a tradeable index of actual hedge funds. It is a suitable benchmark for the Crescat Global Macro private fund which has also traded in multiple asset classes and applied a multi-disciplinary investment process since inception.
HFRX EQUITY HEDGE INDEX. The HFRX Equity Hedge Index represents an investable index of hedge funds that trade both long and short in global equity securities. Managers of funds in the index employ a wide variety of investment processes. They may be broadly diversified or narrowly focused on specific sectors and can range broadly in terms of levels of net exposure, leverage employed, holding periods, concentrations of market capitalizations and valuation ranges of typical portfolios. It is a suitable benchmark for the Crescat Long/Short private fund, which has also been predominantly composed of long and short global equities since inception.
PHILADELPHIA STOCK EXCHANGE GOLD AND SILVER INDEX. The Philadelphia Stock Exchange Gold and Silver Index is the longest running index of global precious metals mining stocks. It is a diversified, capitalization-weighted index of the leading companies involved in gold and silver mining. It is a suitable benchmark for the Crescat Precious Metals private fund and the Crescat Precious Metals SMA strategy, which have also been predominately composed of precious metals mining companies involved in gold and silver mining since inception.
S&P 500 INDEX. The S&P 500 Index is perhaps the most followed stock market index. It is considered representative of the U.S. stock market at large. It is a market cap-weighted index of the 500 largest and most liquid companies listed on the NYSE and NASDAQ exchanges. While the companies are U.S. based, most of them have broad global operations. Therefore, the index is representative of the broad global economy. It is a suitable benchmark for the Crescat Global Macro and Crescat Long/Short private funds, and the Large Cap and Precious Metals SMA strategies, which have also traded extensively in large, highly liquid global equities through U.S.-listed securities, and in companies Crescat believes are on track to achieve that status. The S&P 500 Index is also used as a supplemental benchmark for the Crescat Precious Metals private fund and Precious Metals SMA strategy because one of the long-term goals of the precious metals strategy is low correlation to the S&P 500.
SPDR Gold Shares is an exchange-traded fund (ETF) that provides investors with exposure to the price movements of gold. It is one of the largest and most widely traded gold ETFs globally. The fund is designed to track the performance of the price of gold bullion, minus the expenses involved in managing the ETF.
iShares Silver Trust is an exchange-traded fund (ETF) that aims to provide investors with exposure to the performance of the price of silver. Similar to other precious metal ETFs, the iShares Silver Trust holds physical silver bullion to back its shares.
VanEck Vectors Junior Gold Miners is an exchange-traded fund (ETF) that provides investors with exposure to the performance of small and mid-cap companies in the gold mining industry. The index includes a diversified mix of small and mid-cap companies involved in the exploration and production of gold and other precious metals.
VanEck Vectors Gold Miners is an exchange-traded fund (ETF) that seeks to replicate the performance of the NYSE Arca Gold Miners Index. This index consists of companies involved in the gold mining industry which includes a diversified portfolio of companies engaged in the exploration, development, and production of gold and other precious metals.
References to indices, benchmarks or other measures of relative market performance over a specified period of time are provided for your information only. Reference to an index does not imply that the fund or separately managed account will achieve returns, volatility or other results similar to that index. The composition of an index may not reflect the manner in which a portfolio is constructed in relation to expected or achieved returns, portfolio guidelines, restrictions, sectors, correlations, concentrations, volatility or tracking.
Separately Managed Account (SMA) disclosures: The Crescat Large Cap Composite and Crescat Precious Metals Composite include all accounts that are managed according to those respective strategies over which the manager has full discretion. SMA composite performance results are time-weighted net of all investment management fees and trading costs including commissions and non-recoverable withholding taxes. Investment management fees are described in Crescat’s Form ADV 2A. The manager for the Crescat Large Cap strategy invests predominantly in equities of the top 1,000 U.S. listed stocks weighted by market capitalization. The manager for the Crescat Precious Metals strategy invests predominantly in a global all-cap universe of precious metals mining stocks.
Hedge Fund disclosures: Only accredited investors and qualified clients will be admitted as limited partners to a Crescat hedge fund. For natural persons, investors must meet SEC requirements including minimum annual income or net worth thresholds. Crescat’s hedge funds are being offered in reliance on an exemption from the registration requirements of the Securities Act of 1933 and are not required to comply with specific disclosure requirements that apply to registration under the Securities Act. The SEC has not passed upon the merits of or given its approval to Crescat’s hedge funds, the terms of the offering, or the accuracy or completeness of any offering materials. A registration statement has not been filed for any Crescat hedge fund with the SEC. Limited partner interests in the Crescat hedge funds are subject to legal restrictions on transfer and resale. Investors should not assume they will be able to resell their securities. Investing in securities involves risk. Investors should be able to bear the loss of their investment. Investments in Crescat’s hedge funds are not subject to the protections of the Investment Company Act of 1940. Performance data is subject to revision following each monthly reconciliation and annual audit. Current performance may be lower or higher than the performance data presented. The performance of Crescat’s hedge funds may not be directly comparable to the performance of other private or registered funds. Hedge funds may involve complex tax strategies and there may be delays in distribution tax information to investors.
Investors may obtain the most current performance data, private offering memoranda for Crescat’s hedge funds, and information on Crescat’s SMA strategies, including Form ADV Part II, by contacting Linda Smith at (303) 271-9997 or by sending a request via email to lsmith@crescat.net. See the private offering memorandum for each Crescat hedge fund for complete information and risk factors.