Since the early 1980s, the global economy has rejoiced in a long period of significant cooperation among nations in supporting each other’s government financing needs. However, given the growing escalation of geopolitical tensions and the unraveling of longstanding trade partnerships, we believe that the present circumstances are likely to signify the end of an era defined by financial globalization.
With few choices to maneuver amidst today’s macro imbalances, developed economies are experiencing an exponential proliferation of their debt problem, propelled by both higher global interest rates and a pressing need for ongoing fiscal spending at extreme levels. Those seeking historical parallels would find that the current surge in sovereign debt issuances is unparalleled. Even during the 1940s, a period characterized by high levels of government debt, there was a degree of stability with the US monetary system anchored to gold. Today’s environment presents a stark contrast. Despite inflationary pressures pervasive in the economy, we are witnessing what might be described as the most undisciplined monetary and fiscal environment in history.
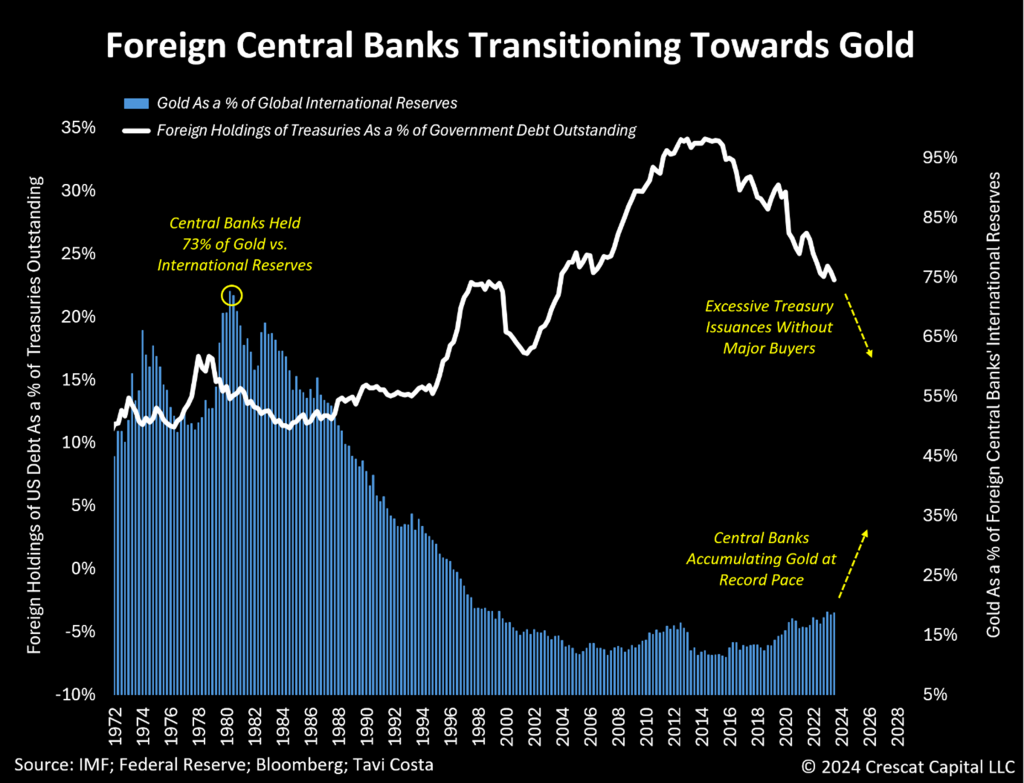
Central banks are left with no recourse but to assume responsibility for these challenges, acting as primary liquidity providers to address their own sovereign debt and asset valuation imbalances. Consequently, gold’s role as a universal, neutral asset with millennia of history as money, is experiencing a resurgence relative to US Treasuries for global central bank reserve accumulations.
The Most Aggressive Infrastructure Spending of the Past Century
The reality is that excessive levels of debt often precipitate escalating geopolitical tensions and conflicts, and as disagreements among nations intensify, there arises a greater imperative for countries to bolster their self-reliance on domestic operations. These circumstances are poised to catalyze what could evolve into one of the most ambitious infrastructure initiatives in history, with the potential to be highly inflationary.
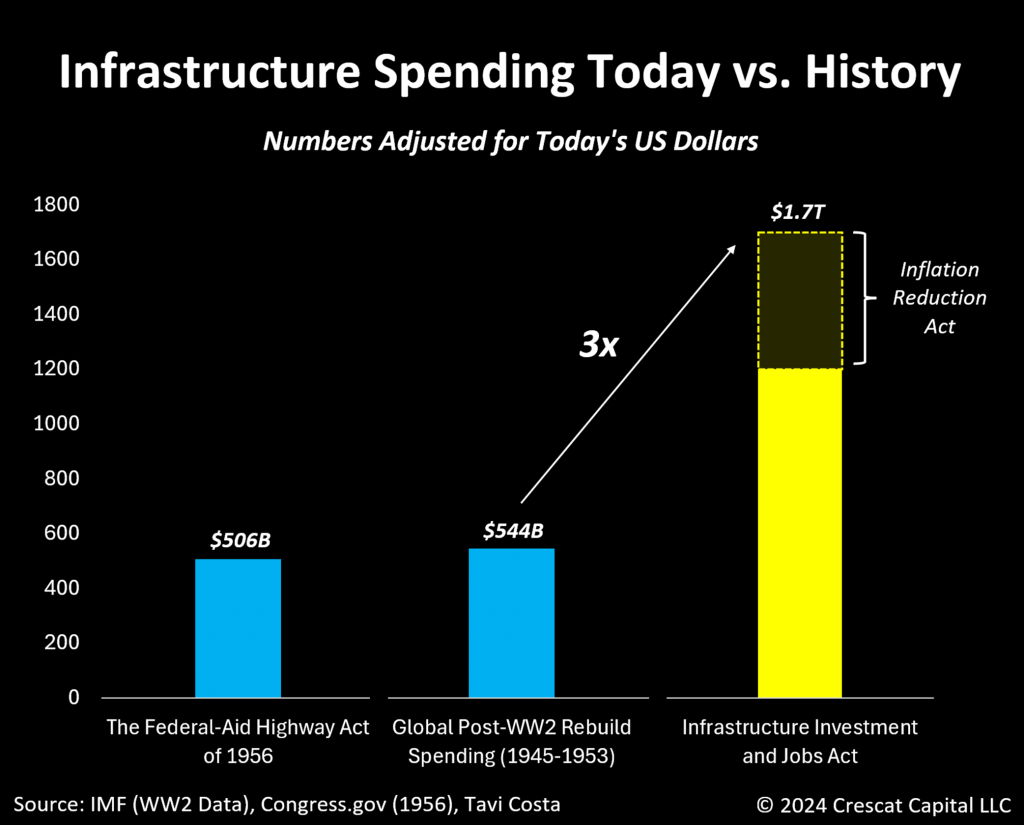
The last major infrastructure push in the United States occurred in 1956 with the National Interstate and Defense Highway Act under President Dwight D. Eisenhower. Initially budgeted at $25 billion, equivalent to approximately $207 billion in today’s currency, this initiative pales in comparison to the recent Infrastructure Investment and Jobs Act, which authorizes government spending nearly six times that amount, totaling $1.2 trillion.
Even more astonishing is the historical comparison of global spending on infrastructure reconstruction following World War II. The United States, primarily through the Marshall Plan (officially known as the European Recovery Program or ERP), expended approximately $153 billion in today’s currency. When combined with the expenditures of other nations, the total surpassed $544 billion in today’s currency which to put in context is less than half of today’s US infrastructure initiative alone.
The chart below illustrates the stark contrast between today’s infrastructure overhaul and other monumental programs throughout history. In this calculation, we also added $500 trillion in spending authorized under the misnamed Inflation Reduction Act passed in 2022 mostly for green energy infrastructure projects.
A Paradox: Booming Construction With Plunging Capex
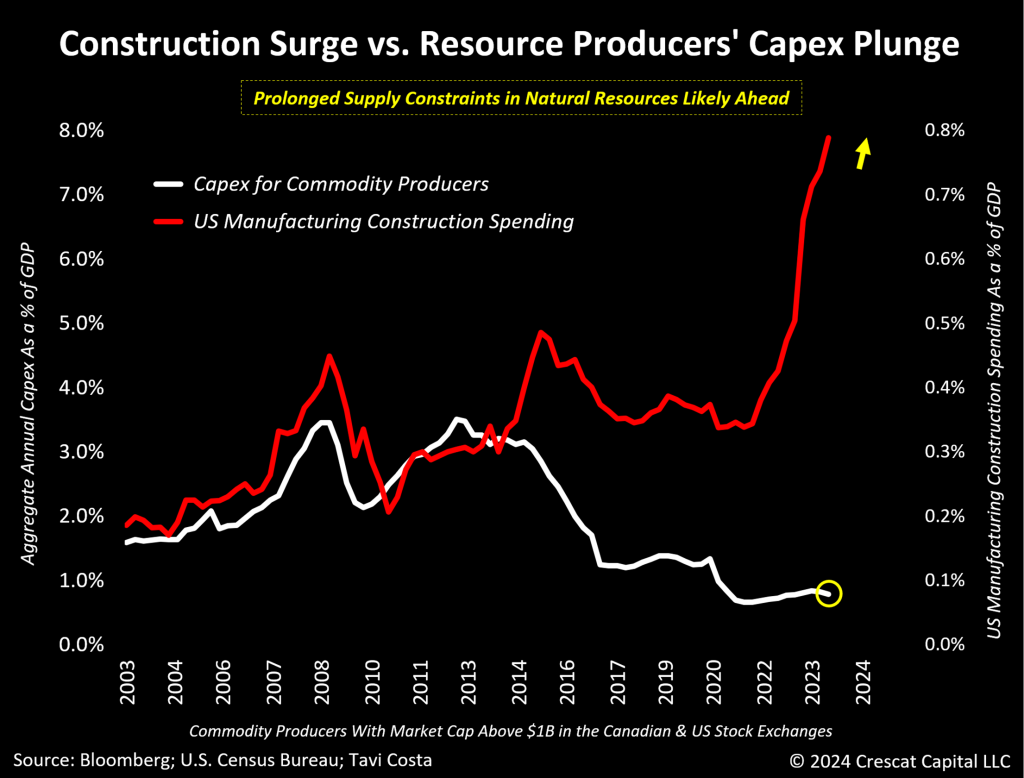
Nevertheless, as shown in the chart below, today’s predicament lies in the fact that despite the recent upsurge in construction spending, especially for manufacturing, commodity producers have evidently fallen short of matching this trend. Capital expenditure in natural resource industries has remained near historically low levels, especially when adjusted for GDP.
It is important to bear in mind that changes in the supply curve of commodities typically align with the capital spending behavior of underlying producers, albeit with a significant lag effect. Essentially, it requires time for investments to translate into increased supply. The current scarcity of capex among these producers, juxtaposed with the upsurge in construction expenditure fueling material demand, ,in our analysis, portends significantly higher commodity prices to balance these markets in the face of these structural supply constraints. Significantly higher prices, in our view, will be necessary to incentivize new capex investment, and it will take many years before these new supplies come on stream in a significant enough way to alleviate pricing conditions. It has been taking a decade or more on average to bring a new discovery into production in today’s global anti-mining climate given the environmental and social licensing, government permitting, and capital-raising challenges.
The Next Big Short: Fiat Debasement
From an investment standpoint, it’s difficult to imagine that all these economies will be able to effectively revamp their manufacturing capabilities without significantly increasing the importance of the metals and mining industry beyond its current market size. Therefore, at historically undervalued prices, we believe mining companies currently offer a highly compelling value and macro proposition for investors.
Running a mining company is a complex and capital-intensive venture fraught with potential pitfalls. Owning only best run of these is critical at all times. Knowing when to overweight the industry in one’s portfolio is also important. There are stretches of time when mining stocks at large can outperform the broad market, as experienced in the 1940s, the 1970s, and the 2000s providing important diversification to investor portfolios These prosperous times are frequently associated with prolonged inflationary periods and/or commodity cycles, a trend we strongly believe we are currently entering.
At Crescat, we are contrarians at heart. We cannot think of a segment of the market that is as universally disparaged as mining today, especially gold mining. Perhaps the coal industry experienced similar scorn three years ago, only to then have one of its biggest runups in history in 2021 and 2022.
However, having a contrarian stance solely for its own sake is not enough. For us, there needs to be a substantial macro case for both inflation and mining investment, which we believe we have. Here is brief but non-exhaustive summary:
- Unsustainably high government debt to GDP
- An inflationary fiscal agenda driven by deficit spending and infrastructure projects
- Accommodative, financially repressive global central banks
- Commodity supply-and-demand imbalances including declining gold production
- A geopolitical climate driving de-globalization and near-shoring of supply chains
- Increasing wage-inflation pressures
- A populist political climate
- Global central bank gold accumulation
For us, these reasons provide a strong case for gold to embark on a secular bull market. If this holds true, it’s likely to unlock numerous opportunities across other metals and businesses engaged in the exploration, development, and production of these commodities.
The last two gold bull markets spanned approximately a decade each.If this marks the commencement of a new long-term trend, mining companies represent one, if not the most, undervalued opportunities in today’s markets. More importantly, historically, there has never been a bull market in gold that is not accompanied by a notable re-rating of valuations among the miners.
Additionally, the present inflationary backdrop, coupled with the increasing deglobalization pressures at its core and nations facing an urgent need to rebuild their infrastructure, creates an exceptionally favorable environment for overall miners from our perspective. Let us not forget that even the advancements in artificial intelligence are likely to fuel the construction boom with significant developments in data centers that are crucial for providing the computing power for this technology to embed itself in the economy.
Global data center investment to date is about $1 trillion, according to Nvidia CEO, Jensen Huang, and is expected to double globally over the next four to five years. The Chips and Science Act has appropriated $56 billion to help with this cause but most of the money is expected to come from industry. This amount dwarfs the current size of the semiconductor industry, which sold about $527 billion worth of chips globally last year. Sam Altman, CEO of OpenAI, according to a recent Wall Street Journal article is calling for future semiconductor industry and data center investments in the range of $5 to $7 trillion to power his AI ambitions. Where could such capital possibly come from and how could it not be inflationary?
The irony lies in the fact that the extensive infrastructure necessary to harness artificial intelligence as a significant force for reducing inflation in the long run and advancing societal productivity will is more likely to increase inflationary pressures in the next five years during the required hardware expansion phase.
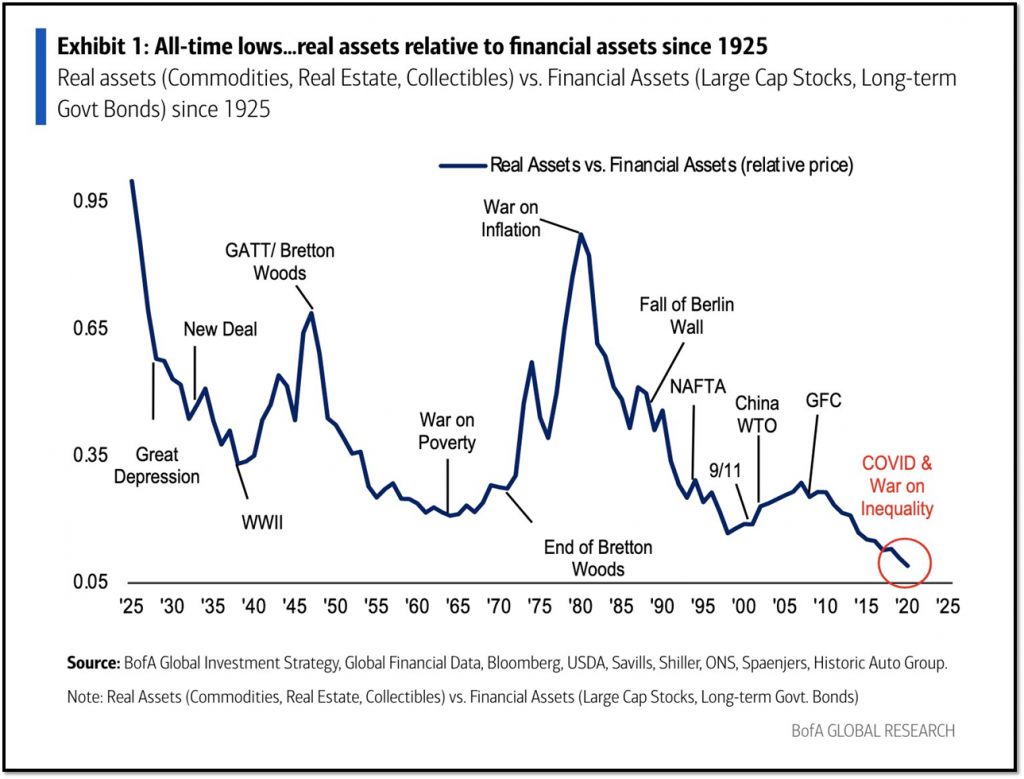
The sheer magnitude of the current macro imbalances is laying the groundwork for one of the most bullish environments for owning hard assets that we have seen in quite some time. According to Bank of America Global Research, real assets are currently at their most undervalued compared to financial assets in history. The continued influx of capital into technology, growth stocks, and long-duration assets, has created one of the most speculative asset valuation environments since the tech bubble. This a point we have been making at Crescat for the last few years, yet this imbalance has only become more extreme. We believe it is ripe for a sharp reversal. We are calling for an investor-led Great Rotation out of financial assets and into real assets and believe it will emerge soon and could be extremely powerful like it was in the 1970s as one can see in the chart below. It’s worth noting that real assets have historically outperformed financial assets during inflationary decades like the 1940s and 1970s and also in construction-led commodity bull markets like the 2000s. We anticipate both of those environments directly ahead.
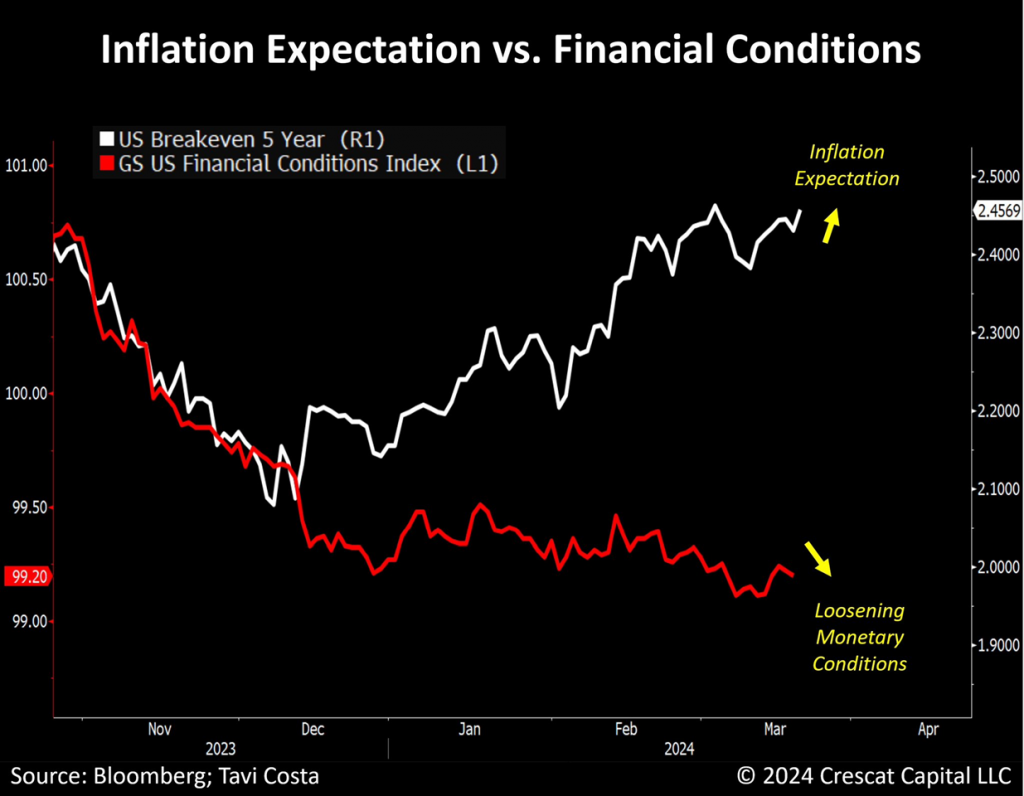
Loosening Monetary Conditions With Rising Inflation
The argument for owning real hard assets becomes even more compelling when taking into account the Federal Reserve’s commitment to initiating interest rate reductions amid a noticeable uptick in inflation.
Three months ago, it was undoubtedly more challenging to predict the potential emergence of a second wave of inflation. However, with agricultural commodities reaching recent peaks, a surge in global freight costs, gold prices breaking out to record levels, recent upticks in oil prices, growing pressure on shelter costs due to a surge in illegal immigration population, and rising breakevens, it is becoming increasingly clear that a second wave of inflation is now unfolding.
In the meantime, before the anticipated policy shift by the Fed, monetary conditions have already declined to the lowest point in one and a half years, concurrent with an ongoing rise in breakeven rates. We believe this macro scenario presents an ideal environment for commodities to perform well.
A Fifth Pillar of Inflation
At Crescat, we traditionally assessed inflation through the lens of four main pillars: excessive fiscal spending, persistent underinvestment among natural resource industries, the wage-price spiral, and perhaps most crucially, the recent surge in deglobalization trends.
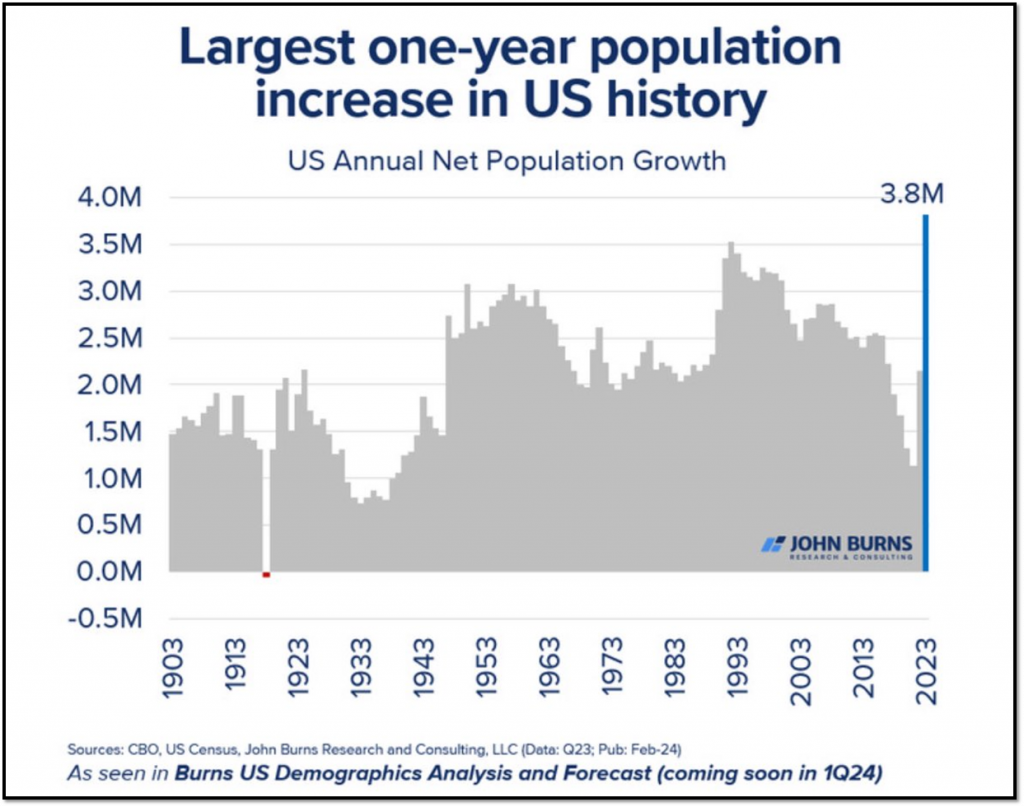
However, a new factor is emerging: the recent uptick in the US population, largely driven by a surge in illegal immigration.
This is an important factor that is likely to exacerbate the already rising house and rent prices. Not only is this the largest component of inflation metrics, but it also impacts consumers the most. The increase in shelter costs resembles the inflationary trends of the 1970s, suggesting a potential long-term trend rather than a short-term phenomenon.
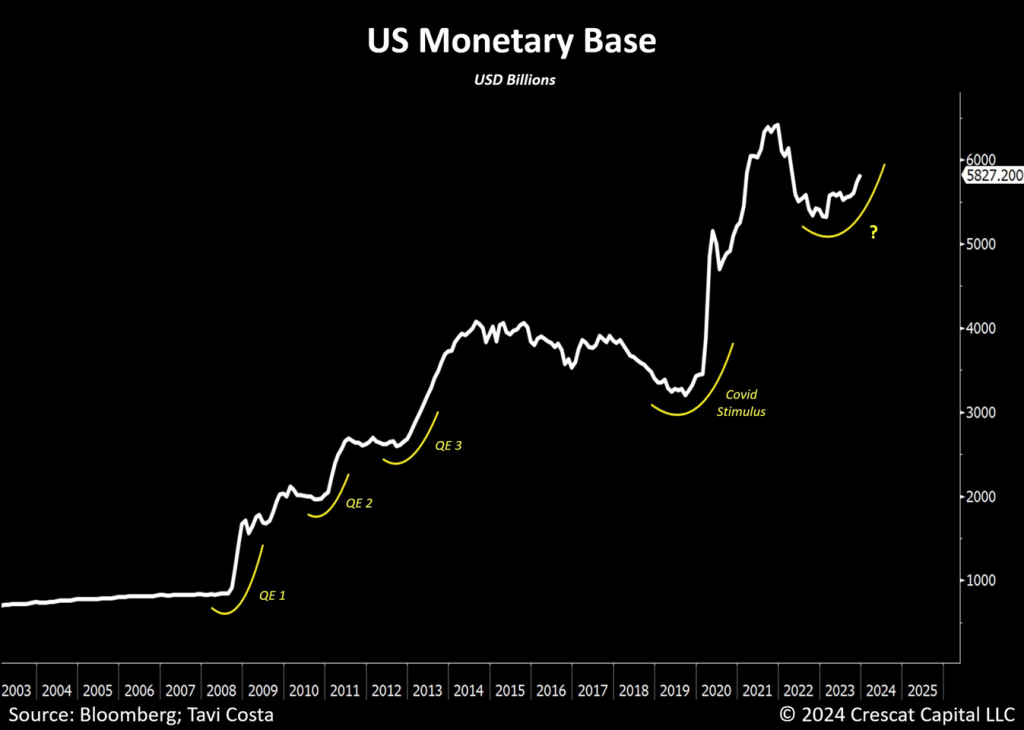
“Not QE”
If the monetary base is increasing despite one of the most restrictive monetary policies in history, what should one expect in a recession? We probably all know the answer to that.
The US monetary base has been rising significantly recently. In the last 12 months alone, there has been a rise of $420 billion, primarily fueled by bank reserves. Although the current Fed policies are supposedly not considered QE, they unmistakably echo the patterns of previous periods of monetary stimulus following the Global Financial Crisis.
The economy’s reliance on easy-money policies has become akin to an addiction, rendering it incapable of sustaining itself without them. These are fundamental policy constraints that have yet to drive the value of hard assets significantly higher.
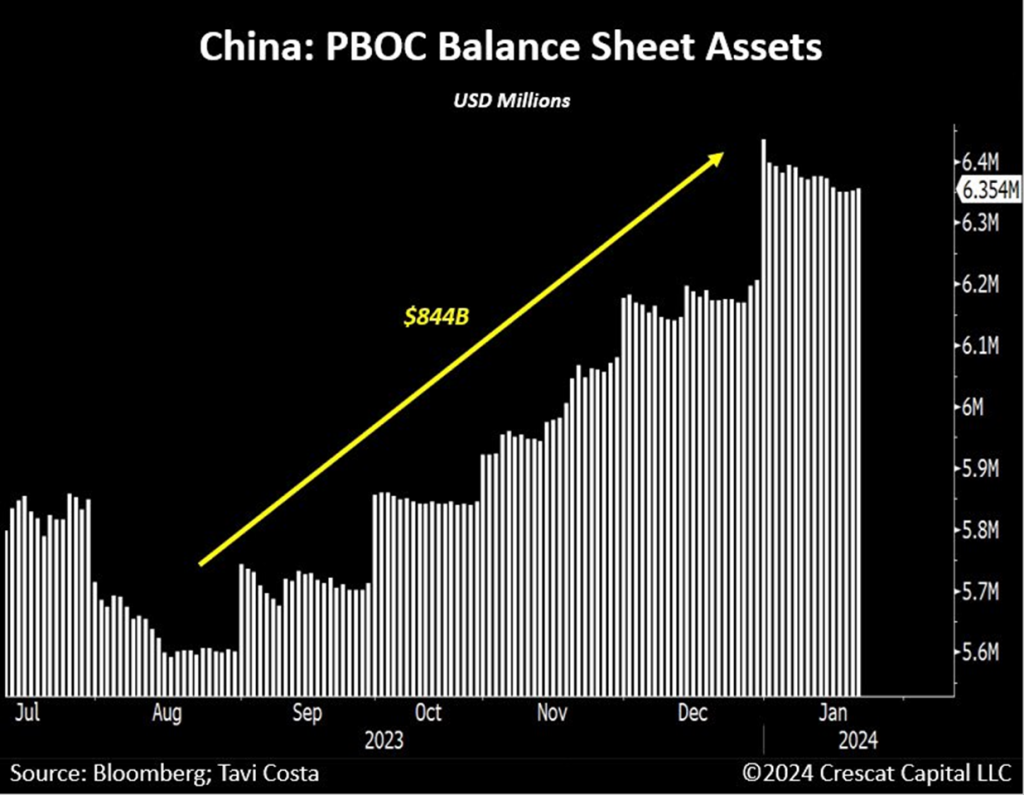
China’s Printing Press is Busy
Having observed this pattern consistently over the past few decades, it is evident that whenever economic issues arise, central banks inevitably resort to additional liquidity injections. This was evident during the US regional banks crisis in March 2023, and now it’s happening with China. Given China’s deepening debt crisis, it’s unsurprising that the PBOC has been active. The Chinese central bank just added $150B to its balance sheet in December. This brings the total increase to almost $850B just in the last 5 months.
Another Commodity Cycle Likely Underway
As central banks find themselves increasingly constrained by political pressures stemming from the exponential growth in overall debt, these institutions are likely to feel compelled to utilize monetary policy as a means of funding to uphold the financial stability of their respective government securities markets. Consequently, the debasement of fiat currencies is likely to emerge as a significant macro theme worldwide, particularly as a hard asset cycle is unleashed, especially when compared to historically expensive financial assets, more meaningfully than in prior decades.
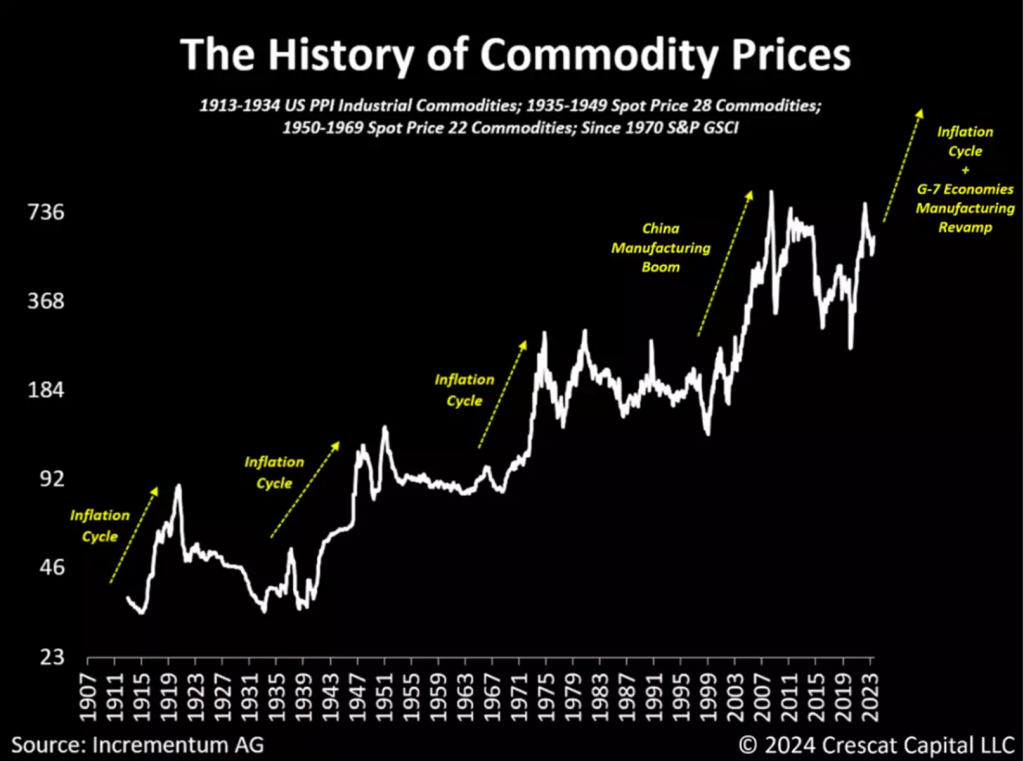
Courtesy of our associates at Incrementum AG, the following chart offers a comprehensive historical perspective. Over the past century, we have witnessed four notable commodity cycles. Among these, three occurred during inflationary periods: the 1910s, 1940s, and 1970s. The fourth cycle unfolded in the early 2000s, coinciding with China’s entry into the World Trade Organization and its ascendancy as the manufacturing hub of the global economy, catalyzing one of the most extensive construction booms in history. Presently, we believe we stand on the brink of witnessing two macro tailwinds concurrently favoring commodities:
- The probable onset of another long-term inflationary cycle.
- A global upsurge in manufacturing across G-7 economies.
In our view, another commodity cycle is underway.
Skepticism Morphing Into Opportunity
No other asset has frustrated investors more than the ongoing expectation of the metal reclaiming its prior peak levels. However, in our strong view, overwhelming skepticism is likely to morph into a major opportunity. After three prolonged years, the consolidation phase in silver prices appears to be approaching an end. The supply case for the metal is even more compelling.
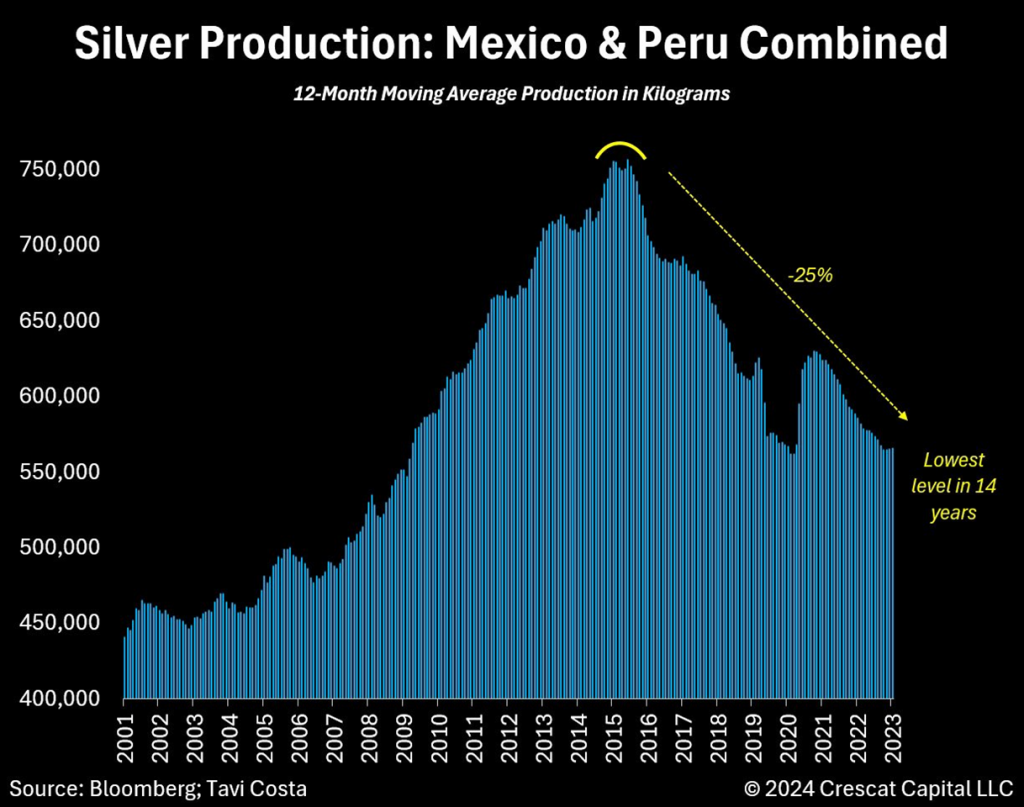
Silver production from Mexico and Peru, the world’s two largest producers, is at its lowest point in 14 years. The combined output is now down 25% from its 2016 peak levels.
As gold breaks out to record levels, igniting a new bull market for precious metals, a major supply and demand mismatch is poised to drive silver prices significantly higher.
A Breakout
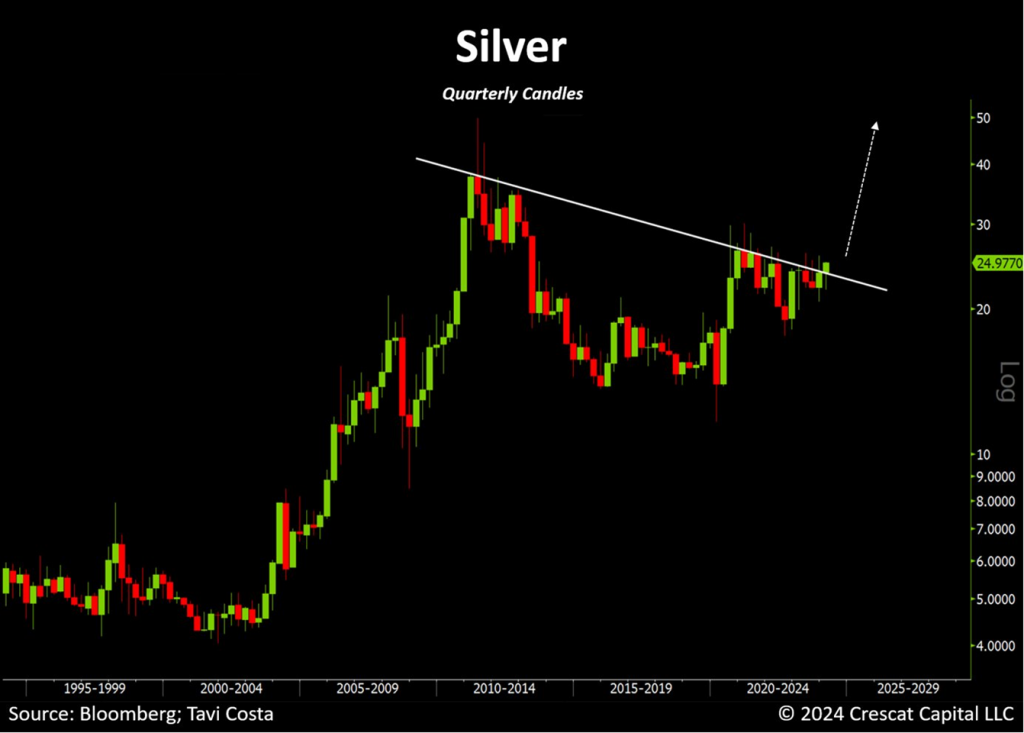
As technical confirmation for our macro views, silver just broke through a 15-year resistance line on the quarterly chart. We think it is one of the most significant breakouts since the early 2000s. Furthermore, the gold-to-silver ratio is still historically high, near 90.
The Roadmap for Silver
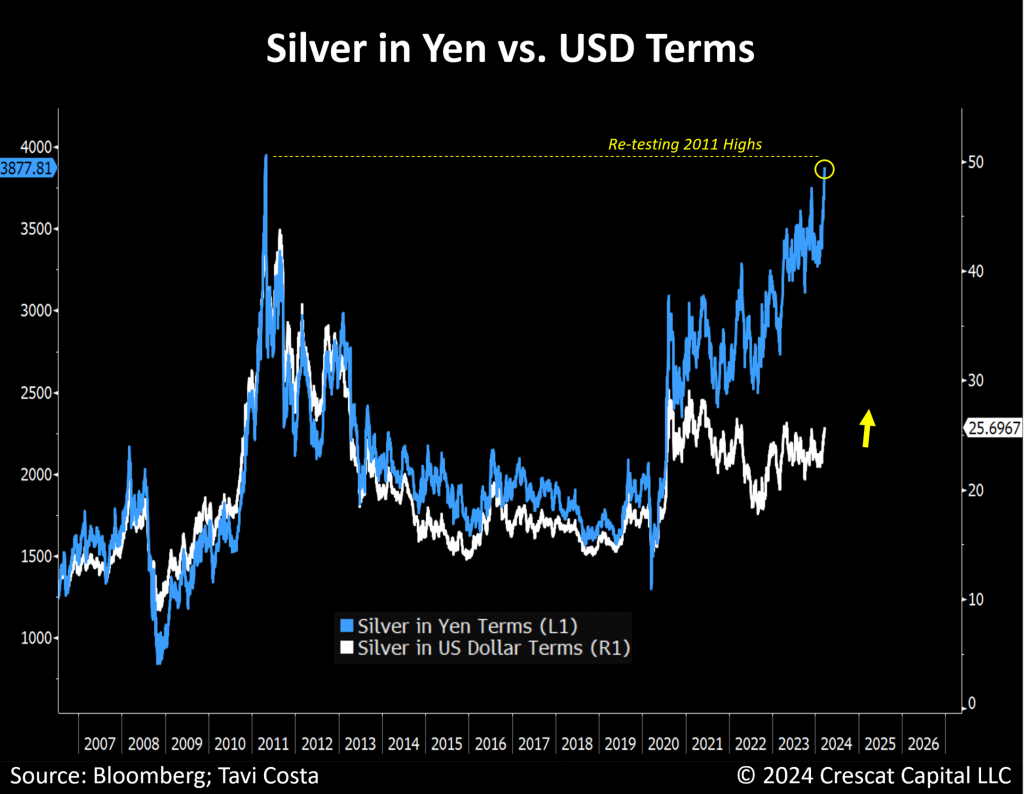
Japan provides a valuable roadmap for where silver prices are likely headed. Persistently high levels of debt have compelled policymakers to consistently resort to financial repression, resulting in a continuous appreciation in the value of hard assets relative to the local currency. In terms of yen, silver is on the verge of re-testing its 2011 highs. With gold gaining momentum and breaking out to new all-time highs, we believe the macro environment is setting the stage for a new secular bull market in precious metals.
One may think we are silver permabulls or gold bugs, but we consider ourselves macro investors, and in our strong opinion, there has never been a more opportune time to build a portfolio of high-quality assets that offer leverage to metal prices than now. For us, the metals and mining industry, currently at one of its most undervalued levels in history, is the most attractive way to express this view in the markets.
General Investors Yet to Follow Suit
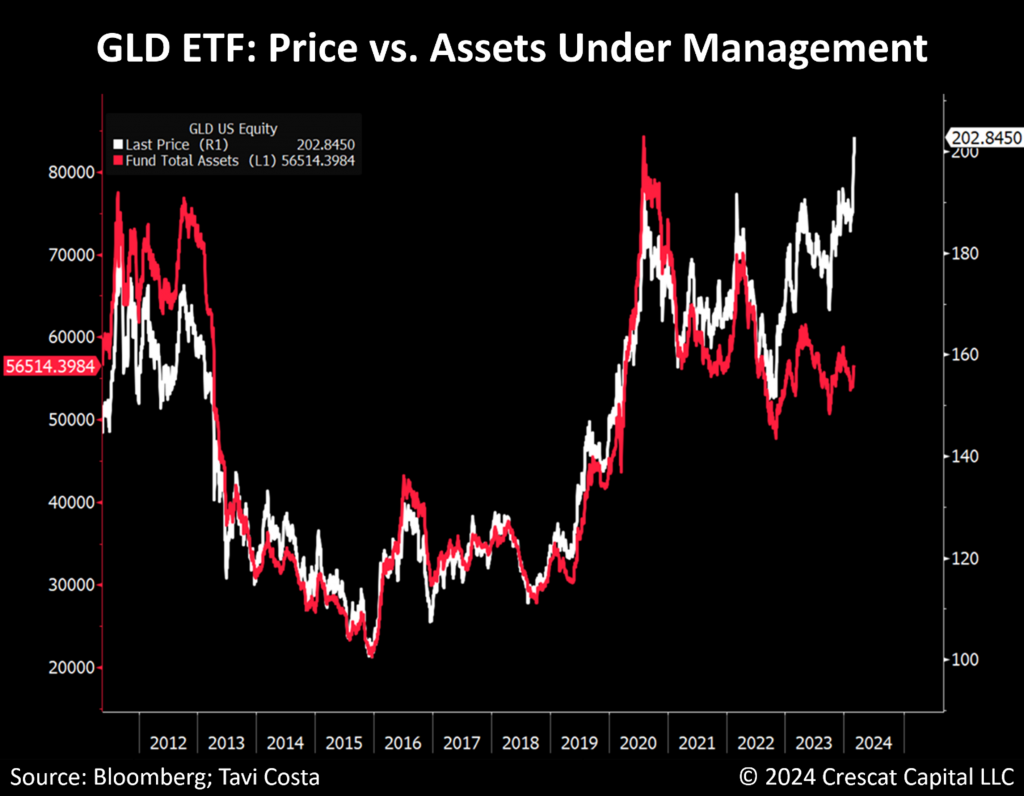
The recent surge in gold prices, despite a lack of corresponding growth in assets managed by related ETFs, suggests that central banks’ purchases have likely been the primary catalyst for the rally.
Keep in mind that although there’s been a record pace of metal accumulation, central banks currently hold a much smaller proportion of gold compared to historical levels. In the late 1970s and early 1980s, these institutions held almost 80% of their balance sheet assets in gold. Today it’s less than 20%.
Considering the significant worldwide debt levels, it’s logical to anticipate central banks prioritizing enhancing the caliber of their international reserves to stabilize monetary conditions. Furthermore, it’s important to acknowledge that overall investors usually mimic the actions of these prominent institutions, and from our perspective, gold has yet to attract substantial flows from generalist capital allocators.
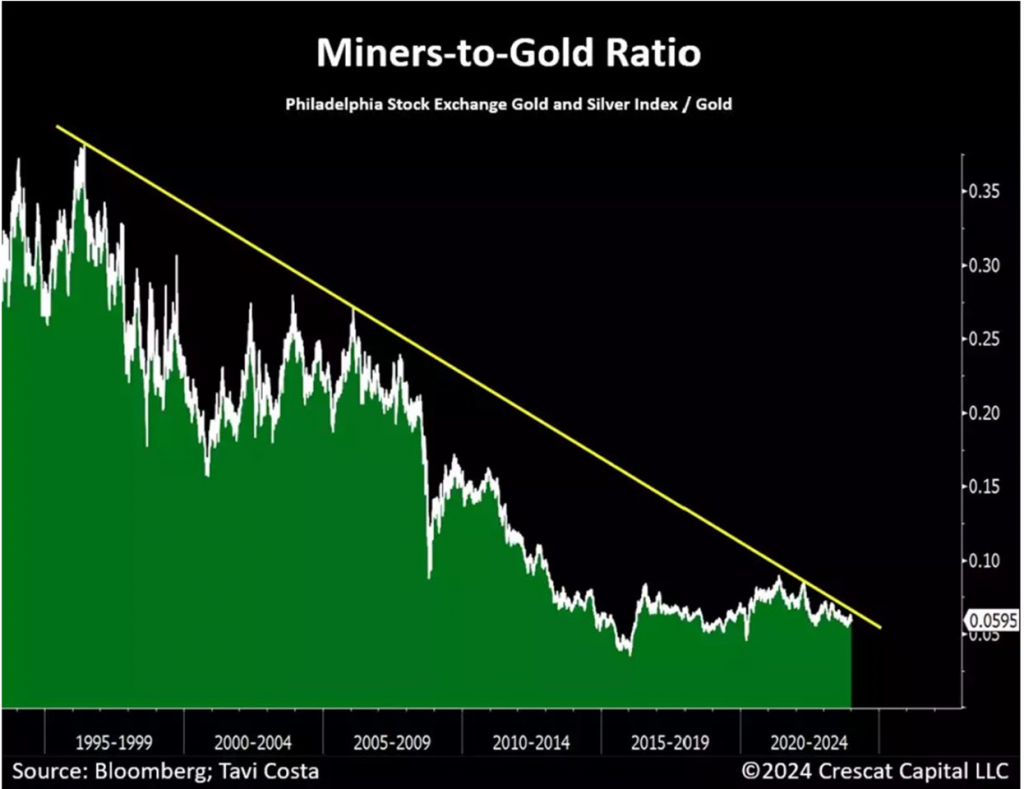
Miners: Universally Disliked
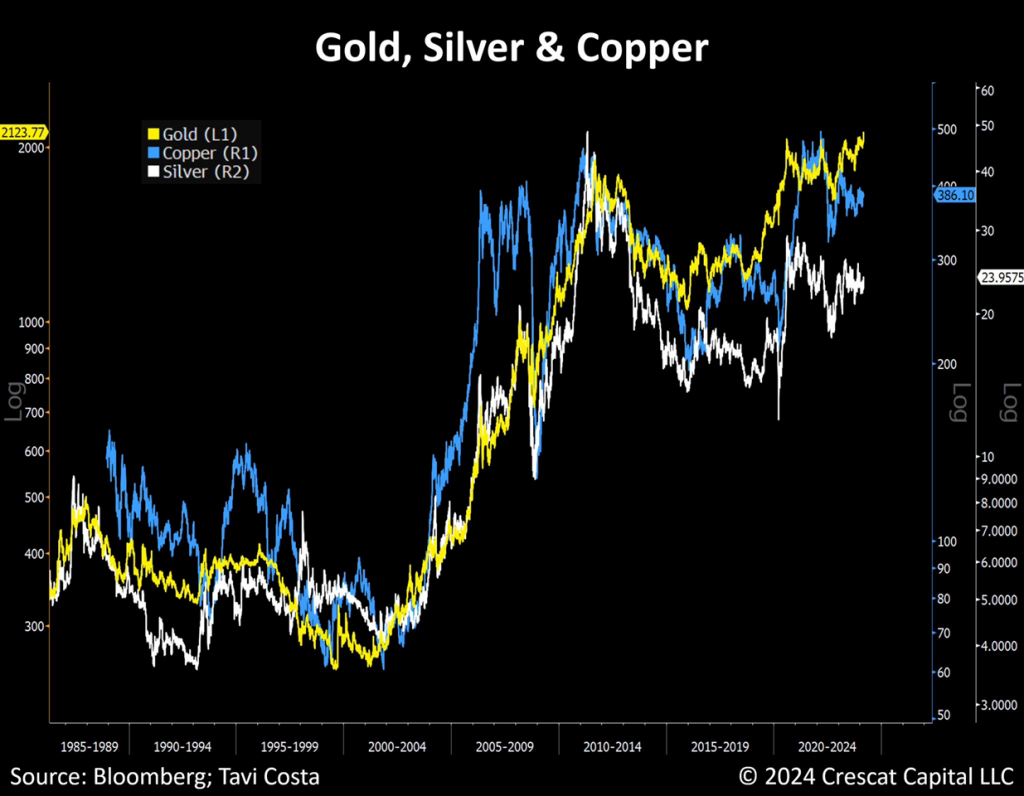
The recent upward trend started with gold, then silver and copper began to move, and now, in our view, it’s time for the miners to follow suit.
Few industries are as universally disliked as mining today. If metals continue to display resilience, which we expect they will, these companies could present some of the best-distressed opportunities in recent memory.
In our analysist, the lack of capital interest and diminishing pool of of geologists and mining engineers coming out of universities over the last decade has set the stage for one of the most supply-constrained metals’ environments in history. From our perspective, mining is one of the most inefficiently valued segments of the market today.
In the money management industry, inefficiency is a synonym for opportunity.
A Distressed State
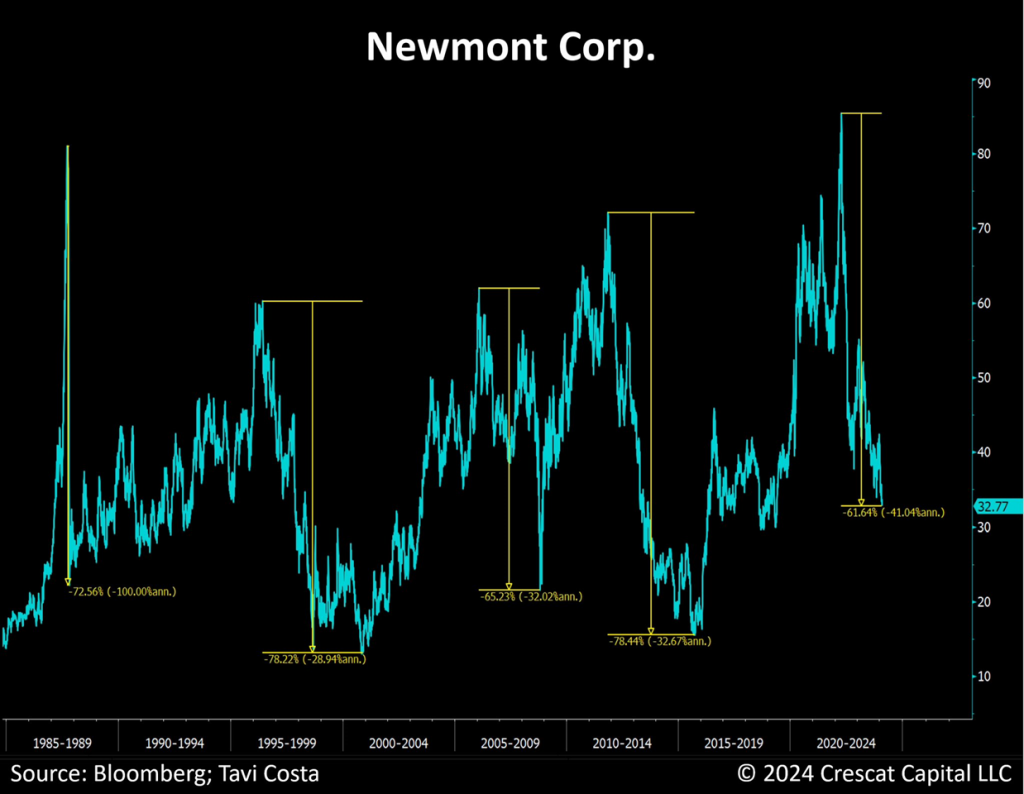
Note that the industry-leading gold mining company, Newmont’s recent stock price decline was nearly as steep as it was during its brief collapse in the Global Financial Crisis. That indeed proved an incredible buying opportunity as its stock price recovered quicky, soaring to new highs in 2010 and 2011. However, mining companies would go on to earn a reputation for being capital mis-allocators for their undisciplined spending on unprofitable projects, particularly from 2010 to 2012.
The opportunity today is that mining executives have gone too far the other way for too long toward investment conservatism, a phenomenon that has now lasted about twelve years. Most investors, in our view, are not aware of this moderation verging on austerity at the largest mining companies, and still perceive these companies are reckless spenders. We think this misperception is setting up a generational buying opportunity given the low valuations combined with favorable supply-and-demand macro setup.
However, while we see strong future fundamental performance ahead for the majors, we are even more interested in the smaller cap exploration-focused companies who have been leading the investment charge on drilling and discovery. In their ultra conservatism, the bigger miners have abdicated this responsibility to the juniors and will have little choice but to acquire the successful smaller cap explorers if they want to stay atop their field. With careful stock selection, we believe there is extraordinarily deep value and high appreciation potential in the explorers, so that is where we are heavily focused at Crescat.
There are occasions when investors are drawn to resource companies, particularly during inflationary periods when capital misallocation transitions into over-conservatism. Given the distressed state of this industry and the likelihood of a continued historical breakout in gold prices, this might be one of the most asymmetric opportunities in today’s markets for near-term as well as long-term investment.
Disclosure: Crescat may or may not hold positions at any given time in the securities referenced herein. This is not a recommendation or endorsement to buy or sell any security or other financial instrument.
Lifting All Boats
When gold enters a cycle, it lifts all boats among other metals. Despite the volatility inherent in each commodity, the macro-opportunity is remarkably similar.
Inflation: Higher for Longer
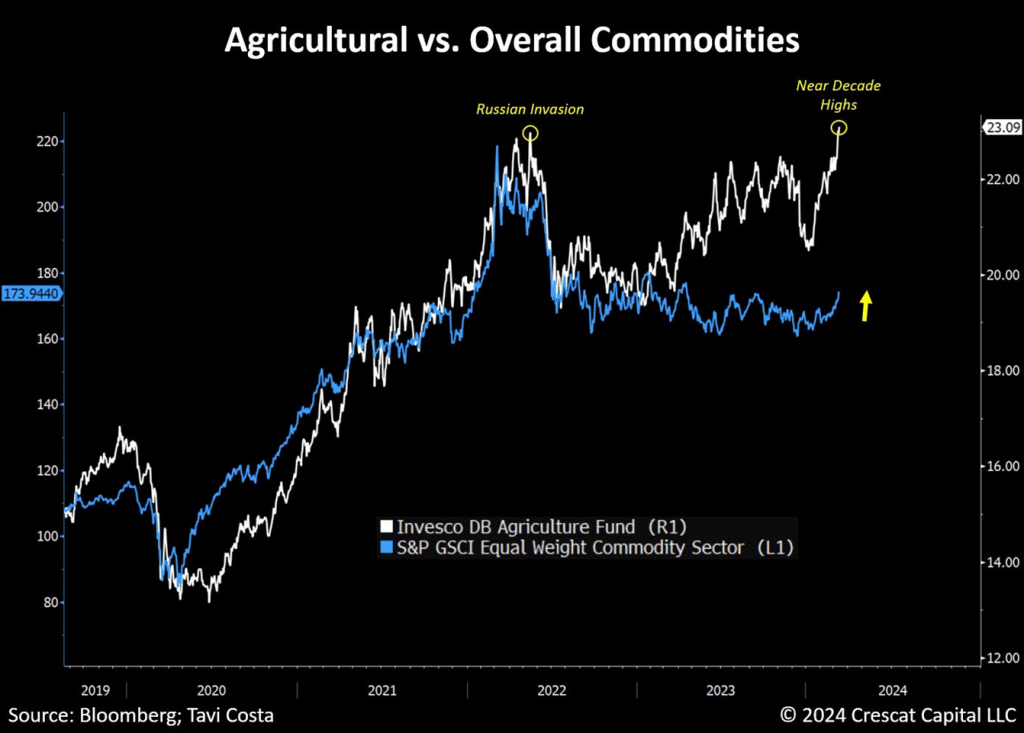
Agricultural commodities just surged above the Russian invasion levels, reaching near-decade highs. This surge is expected to have significant implications for inflation in the global economy, potentially driving food prices substantially higher. It’s worth noting the strong link between agricultural commodities and the equal-weighted commodities index, indicating that other natural resource prices are likely to follow a similar upward trajectory.
The war on rising consumer prices is likely far from over and a potential policy shift by the Fed should only add fuel to the inflation fire. There is a reason why gold recently spiked to record levels, and in our view, this move is just the beginning.
Buy Low & Sell High
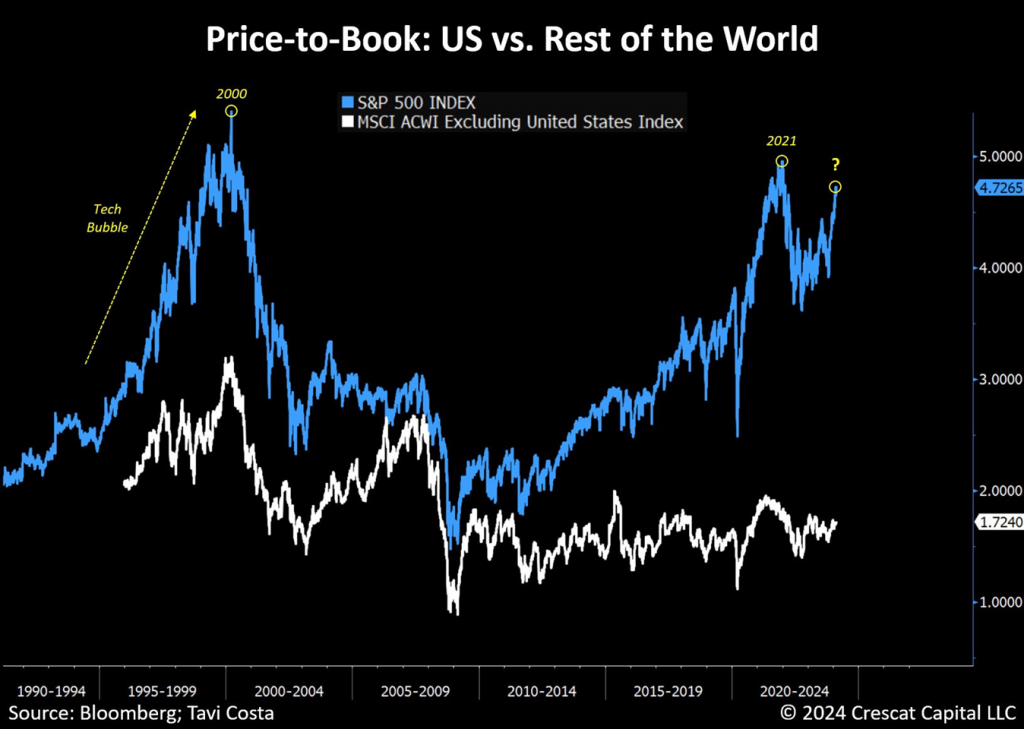
This chart vividly shows the pronounced overvaluation of US equities versus the rest of the world. It’s important to emphasize that price-to-book is just one metric for comparison; others like Buffett’s total market cap of stocks to GDP and Shiller’s CAPE ratio also reveal similar historical disparities worldwide.
Furthermore, notice that the rest of the world is currently as cheap as the US market was at the very bottom of the global financial crisis. This prolonged underperformance is the result of several factors, including the dominance of American technology companies in the sector, chronic underinvestment in commodity-led economies and resource businesses, China’s debt crisis, and various other factors.
So, what changes moving forward?
Looking ahead, we believe the post-pandemic era has reshaped markets and asset correlations.
Increasing deglobalization, persistent government spending, and the liklihood of a growing wage-price spiral are structural macro drivers paving the way for an inflationary environment and attracting capital to undervalued sectors that have been overlooked for decades.
This resurgence underscores a return to value investing, stock selection, and fundamental analysis, fueled by a sustained elevated cost of capital and renewed appreciation for the cyclicality of corporate profit margins which reached unsustainable historic highs in the wake of the Covid stimulus. Profit margins are poised for a potentially sharp correction in an inflationary environment. Neglected segments of the market, including hard assets, commodity businesses, and resource-rich emerging markets, are poised to gain traction in this scenario even as developed markets morph into a potential stagflationary recession.
Easy Gain Are Likely Behind Us
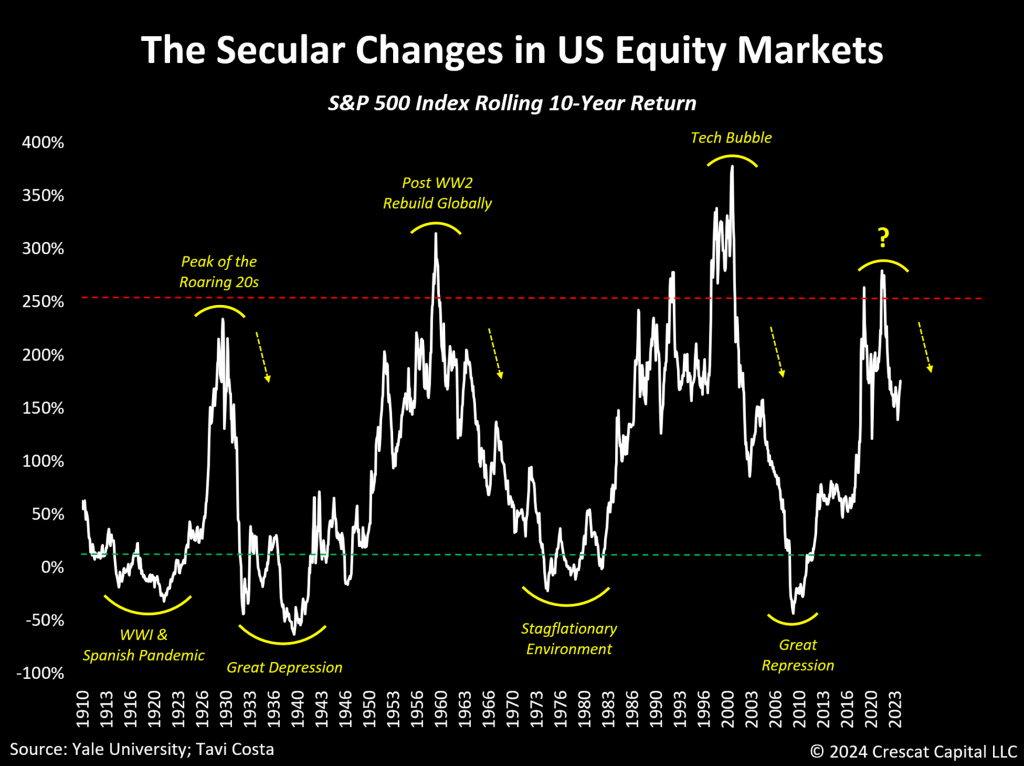
As the business cycle progresses, the long-term returns of US equity markets follow secular trends that experience pivotal turning points when valuations reach extremes. From our perspective, the years of excessive performance in the overall US stock market are likely behind us.
We anticipate a significant shift away from historically overvalued long-duration assets and towards fundamentally undervalued and underappreciated alternatives.
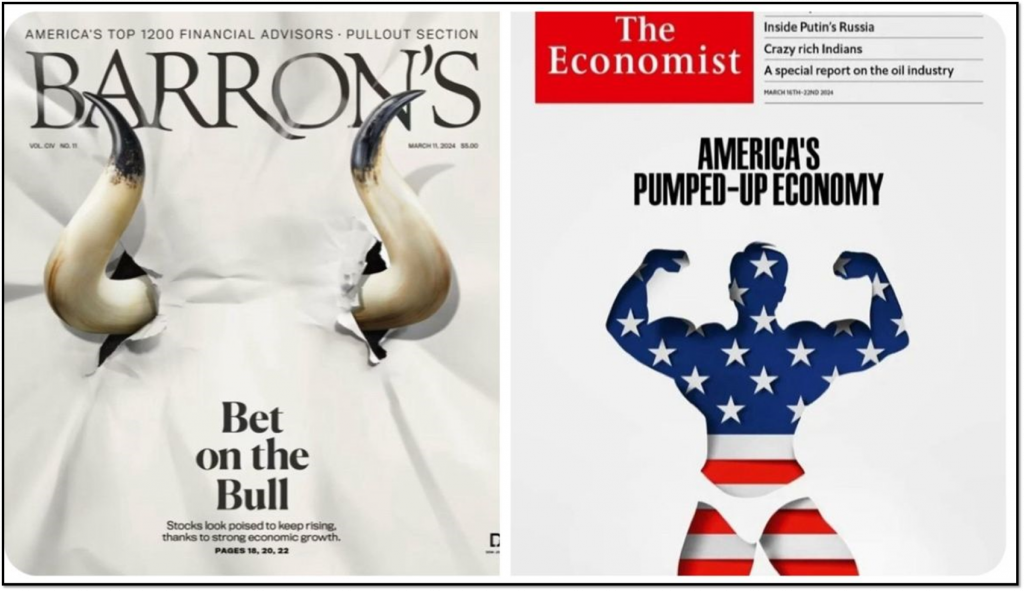
Corporate margins likely have already peaked, and earnings estimates are beginning to decline. Market leadership has significantly narrowed, and the prevalence of overly optimistic magazine covers suggests that sentiment may serve as another indicator signaling the peak of the business cycle.
Magazine Cover Curse
Sentiment plays a crucial role in market timing, and while it’s inherently subjective, magazine covers can offer valuable insights into prevailing levels of optimism. We believe that recent front pages of Barron’s and The Economist are particularly revealing, indicating a significant bullish sentiment among both market participants and the media.
Market concentration is also an issue that concerns us. According to Deutsche Bank, the only other time that 75% of the overall market cap was accounted for by the top decile of companies was at the peak of 1929, prior to the Great Depression.
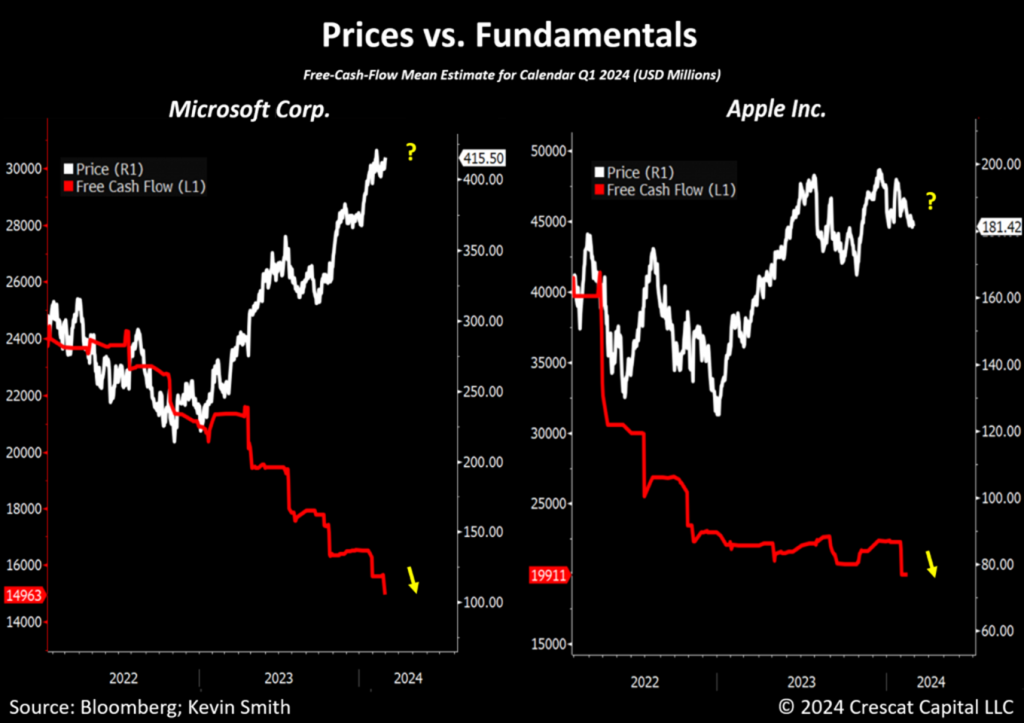
According to our equity model, growth fundamentals for the biggest tech companies have deteriorated substantially and do not support their valuations which still exceed the peak of the 2000 tech bubble. As the chart below shows, analysts’ estimates for Microsoft and Apple’s free cash flow have been trending down for two years, but their stock prices have grossly diverged to the upside.The current quarter could mark the transition from year-over-year growth to a decline in free cash flow at the world’s two largest market-cap companies. It’s a drop of 16.1% at Microsoft and 30.6% at Apple, and no one is paying attention.
Disclosure: Crescat may or may not hold positions at any given time in the securities referenced herein. This is not a recommendation or endorsement to buy or sell any security or other financial instrument.
Fully Allocated
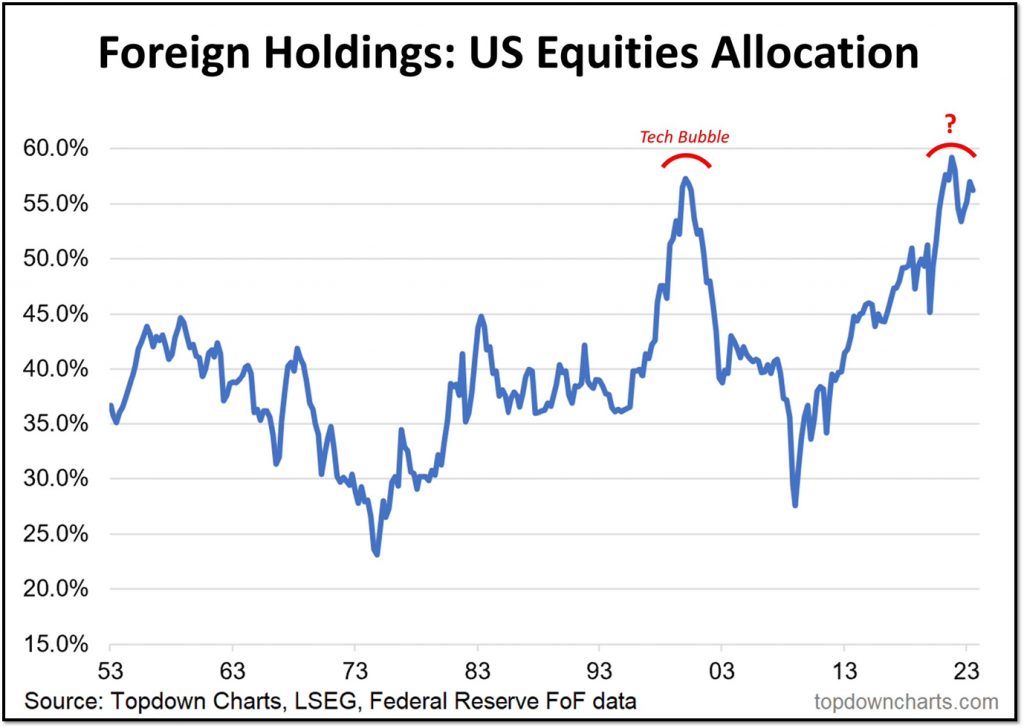
In addition to fundamental analysis, understanding liquidity, positioning and the potential changes in capital flows is arguably one of the most critical tasks to invest wisely.
With that in mind, foreign investors’ allocation in US equities is currently as extreme as they were at the very peak of the tech bubble. Similar to what we experienced back then, the gradual unwinding of crowded sectors like technology is set to unleash another major growth to value rotation in markets. Long-overlooked segments such as emerging markets, natural resource companies, and overall value-driven stocks are poised to emerge as significant winners throughout this next decade.
The Risk for Uncontrollable Inflation
At such extreme valuations, one of the most concerning risks for US equity markets is the potential for an uncontrollable inflationary problem, reminiscent of the stagflationary crisis of 1973-1974. During that period, an oil embargo led to a surge in energy prices, placing the Fed in a difficult position of having to tighten monetary conditions amidst a recession.
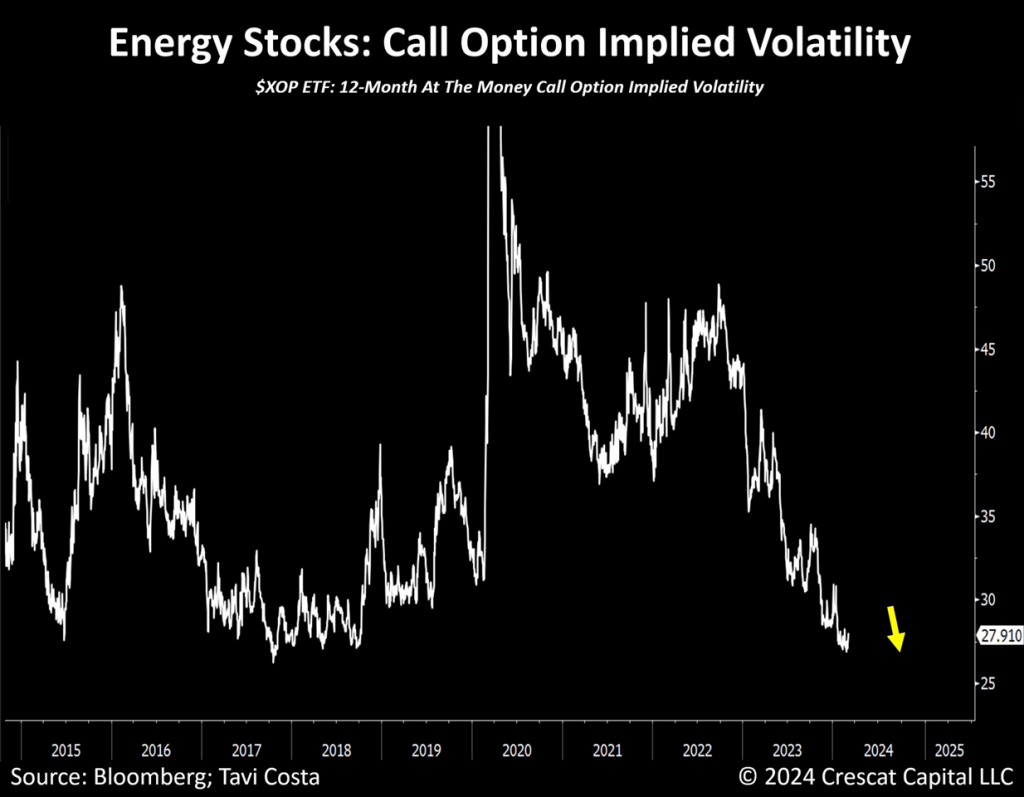
Despite implied volatility for call options in oil nearing all-time lows, it is evident to us that investors do not anticipate a problem in energy prices. Conversely, we strongly believe that inflationary pressures remain deeply entrenched, and the risk of a shock in oil prices is significantly high.
To add, the seasonality for energy stocks and oil is exceptionally favorable at this juncture. Today’s oil setup reminds us of gold a few months ago. Energy has shifted from a prominent narrative to a largely neglected one.
The $85 per barrel price is an important technical level for WTI oil, and a breakout above it could signal a substantial shift in the energy industry, potentially driving prices toward previous highs at $130 per barrel.
Crescat may or may not hold positions at any given time in the securities referenced herein. This is not a recommendation or endorsement to buy or sell any security or other financial instrument.
A Puzzling Comparison
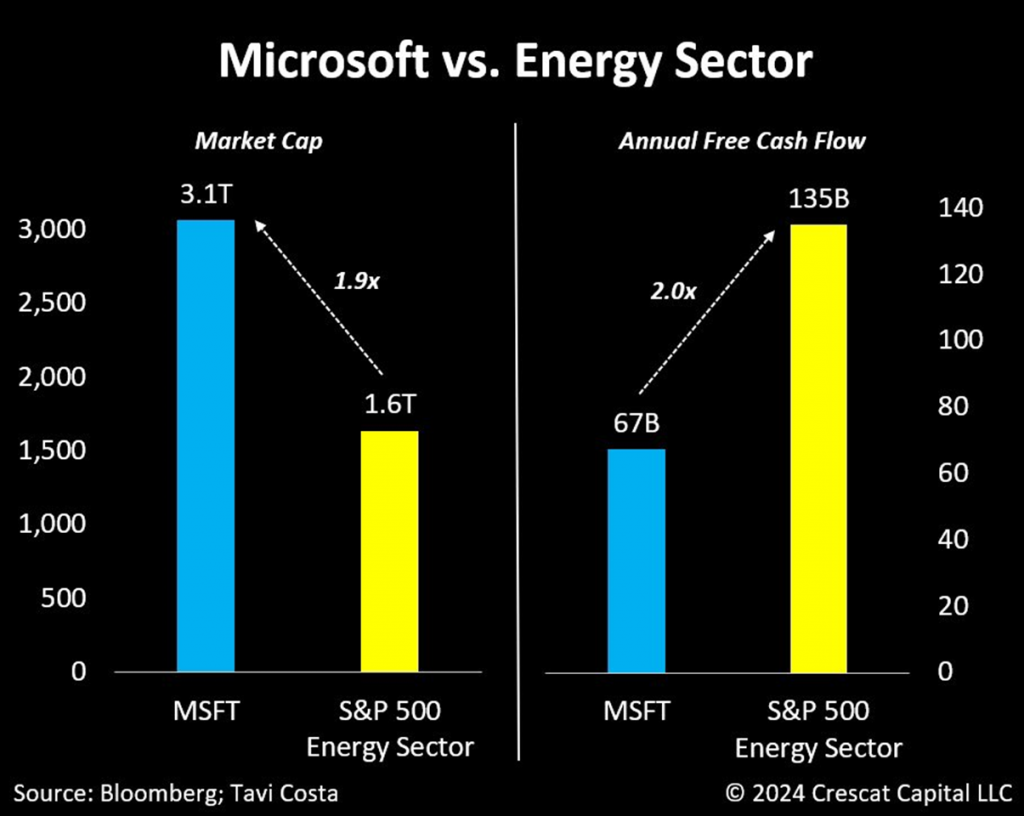
The chart below is an excellent illustration of how extreme the valuations of mega-cap companies have become, despite the fundamental difference in profitability. With a $3 trillion market cap, Microsoft is twice the size of the entire energy sector in the S&P 500, which generates double Microsoft’s annual free cash flow.
Disclosure: Crescat may or may not hold positions at any given time in the securities referenced herein. This is not a recommendation or endorsement to buy or sell any security or other financial instrument.
A Major Disconnect
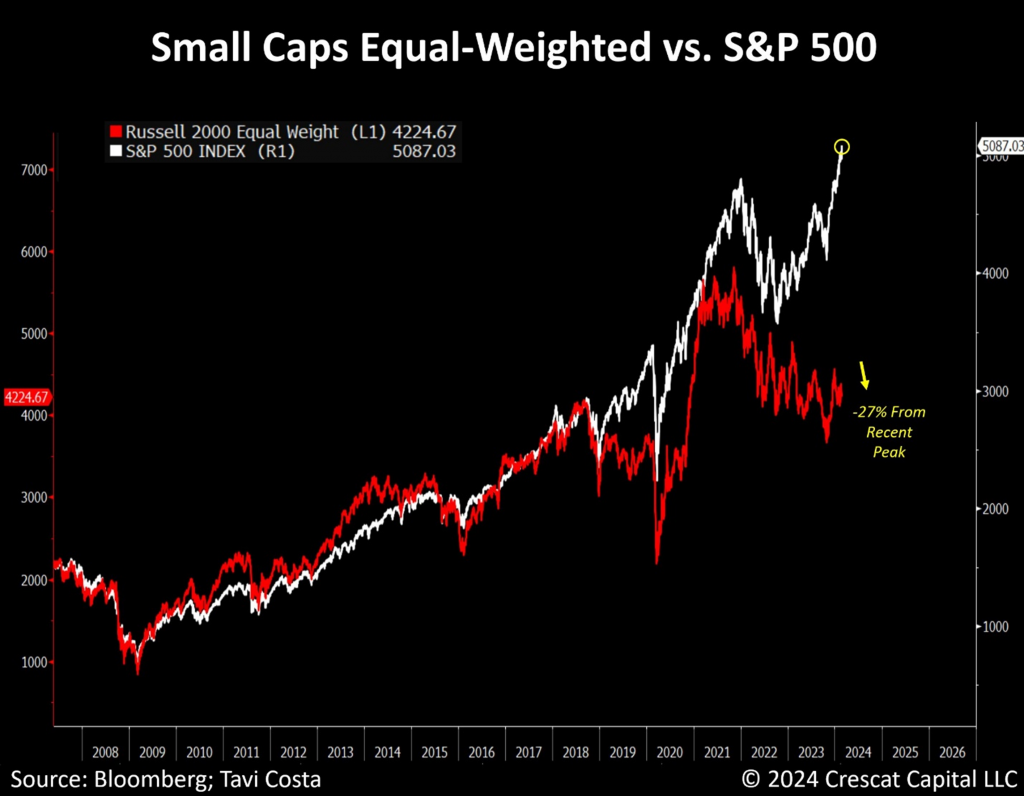
This divergence is bizarre, to say the least. Despite the surge in market-cap indices, small-cap stocks remain deeply entrenched in a bear market, now down 27% from their recent peak.
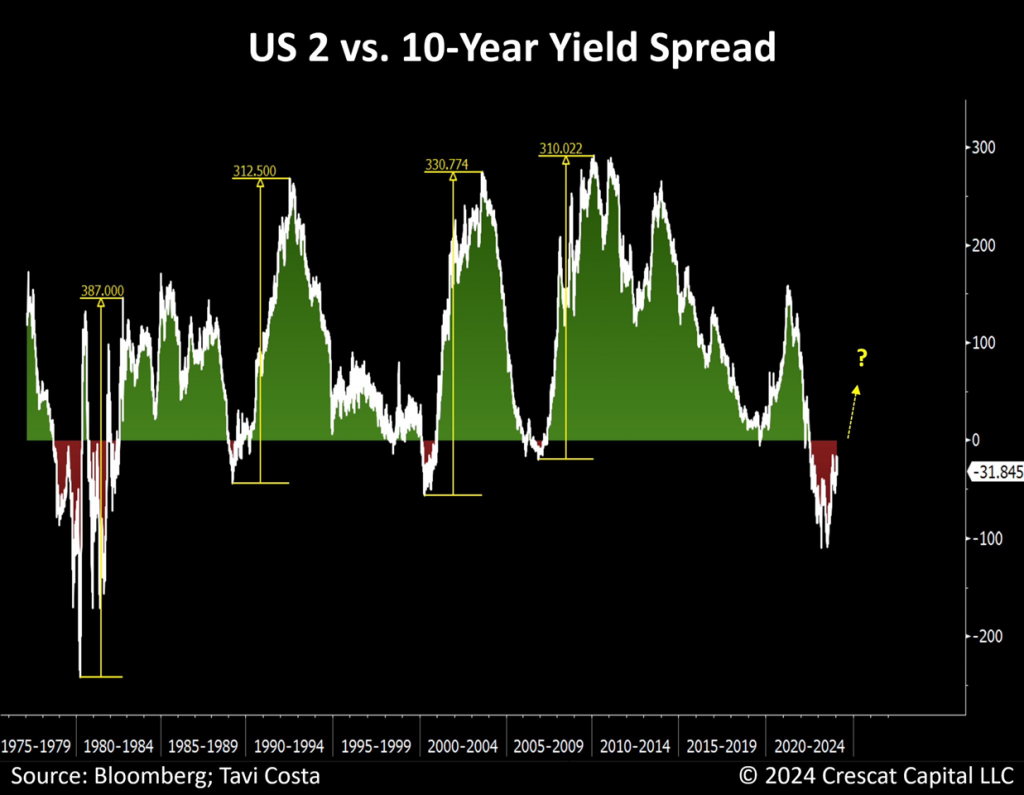
Furthermore, the steepening of the yield curve is one of the most compelling macro trades of the next 6-12 months in our view. After being deeply negative, the overall yield curve appears to be in the process of de-inverting. Using the 2 vs. 10-year yield spread as a proxy, past instances of yield curve steepening have witnessed abrupt changes exceeding 300 basis points from the bottom to the trough.
We believe this is highly likely to happen again today. Today, we are experiencing the lengthiest period in history where the percentage of yield curve inversions in the US Treasury market has remained consistently above the recessionary threshold of 70% for 15 months.
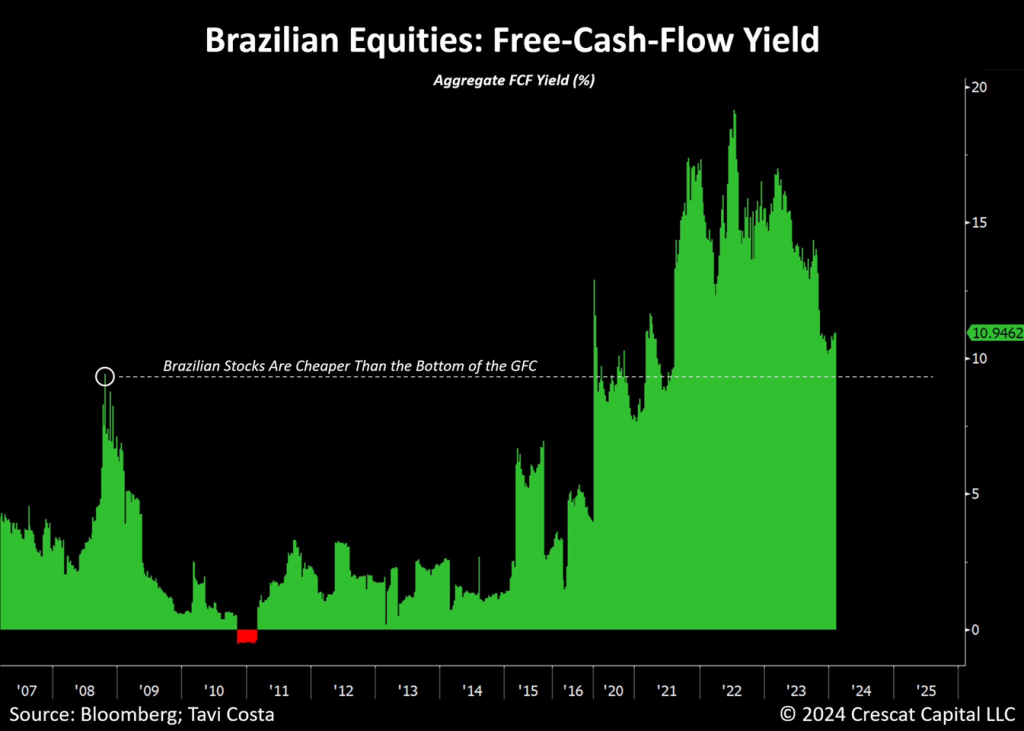
Lastly, we continue to view Brazil as an emerging market that offers an outstanding macro and value opportunity. In fact, Brazilian equities are trading at 5.5 times forward cash flows in one of the most bullish technical setups we have seen. On a free-cash-flow yield basis, these stocks are even more undervalued than they were during the depths of the Global Financial Crisis.
Let us not forget that Brazilian banks are also currently trading at one of the lowest price-to-book levels in history. Prior times when this industry was trading at such cheap multiples also marked great buying opportunities.
Therefore, unlike US markets that remain historically expensive, Brazilian stocks are one part of the world that we view as an attractive investment.
Lastly, while our apprehensions are fueled by the rampant speculation in the US stock market, there is also a parallel narrative where previously neglected economies provide exceptional value and promising growth prospects.
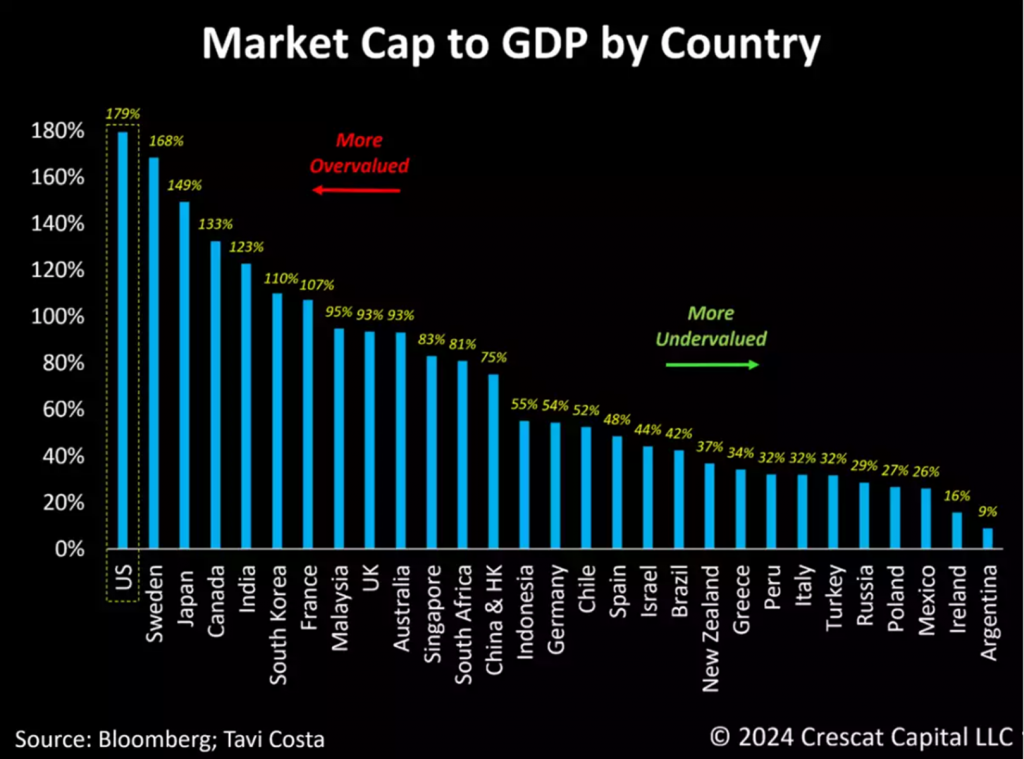
Applying Warren Buffett’s favored valuation metric, it becomes evident that US equities not only stand at historically high levels but also rank as the most overpriced, based on market cap as compared to GDP, among 28 of the world’s largest economies. In our firm opinion, investors venturing into US large cap growth stocks are currently exposing themselves to unwarranted risks amidst dangerously inflated valuations.
Conversely, it’s equally noteworthy to observe the prevalence of economies with significantly lower valuations that also boast substantial exposure to broad commodities exhibiting a favorable supply and demand outlook. In this context, South America emerges as a standout region abundant in natural resources, with markets significantly undervalued, particularly when contrasted with the US.
Given the choice, we prefer to invest in growing businesses with low single-digit price-to-earnings (P/E) ratios rather than in hyped-up US mega-cap technology stocks, such as the “Magnificent 7,” which, on average, trade at exorbitant multiples, with questionable potential to maintain their historical growth rates.
Performance
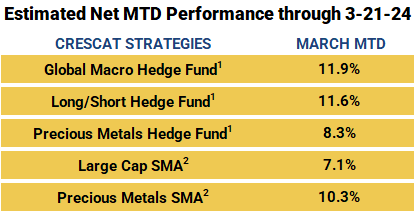
We are encouraged that March has started on the right foot at Crescat with positive performance driven by both the long and short themes in our Global Macro and Long/Short funds. We remain committed to our value-oriented and macro-thematic investment process and positioning. We believe many of our macro themes, as discussed herein, are ripe to unfold.
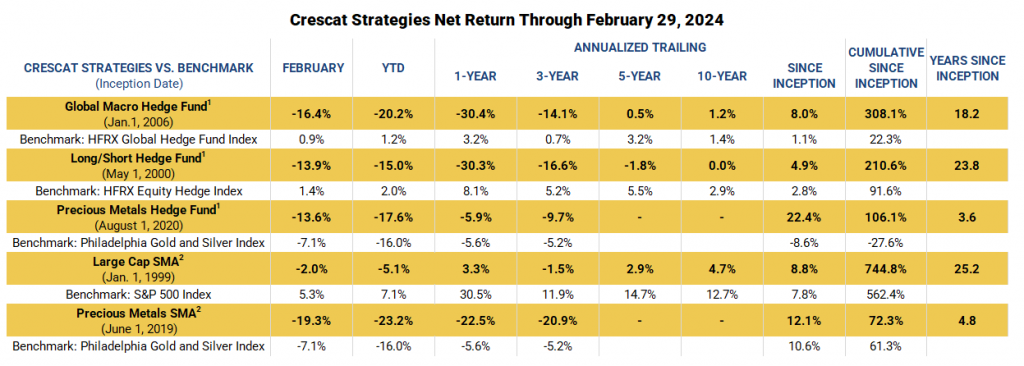
The pullback in Crescat’s strategies through February is hopefully now behind us with the strong reversal in March in line with our macro themes. We believe there is much more to play out in our favor. Value investing and active portfolio management have been out of fashion for too long while growth and momentum investing have taken the forefront along with indexing. We are not interested in chasing past trends that are overextended and poised for correction based on our research. Our fundamental investment principles and models give us the confidence that our portfolios are worth substantially more than the current market price at any given time. As such, we believe there is substantial appreciation potential ahead as we pursue our goal of pushing to new high-water marks in what we see as becoming a much more favorable macro climate for our investment style.
Disclosure: Performance data represents past performance, and past performance does not guarantee future results. Performance data is subject to revision following each monthly reconciliation and/or annual audit. Individual performance may be lower or higher than the performance data presented. The currency used to express performance is U.S. dollars. Before January 1, 2003, the results reflect accounts managed at a predecessor firm. See additional performance disclosures below.
We encourage you to reach out to any of us listed below if you would like to learn more about how our vehicles might fit with your individual needs and objectives.
Sincerely,
Kevin C. Smith, CFA
Founding Member & Chief Investment Officer
Tavi Costa
Member & Macro Strategist
Quinton T. Hennigh, PhD
Member & Geologic and Technical Director
For more information including how to invest, please contact:
Marek Iwahashi
Head of Investor Relations
(720) 323-2995
Linda Carleu Smith, CPA
Co-Founding Member & Chief Operating Officer
(303) 228-7371
© 2024 Crescat Capital LLC
Important Disclosures
The purpose of this letter is to provide access to analyses prepared by Crescat Portfolio Management LLC (“CPM”) with respect to certain companies (“Issuers”) in which CPM and certain of the Funds and accounts it manages are shareholders. The letters enable CPM to share macro themes and newsworthy geologic updates, good and bad, across our Issuers as they arise. The letters represent the opinions of CPM, as an exploration industry advocate, on the overall geologic progress of our activist strategy in creating new economic metal deposits in viable mining jurisdictions around the world. Each Issuer discussed has been selected solely for this purpose and has not been selected on the basis of performance or any performance-related criteria. The securities discussed herein do not represent an entire portfolio and in the aggregate may only represent a small percentage of a strategies holdings. The Issuers discussed may or may not be held in such portfolios at any given time. The Issuers discussed do not represent all of the investments purchased or sold by Funds managed by CPM. It should not be assumed that any or all of these investments were or will be profitable.
Projected results and statements contained in this letter that are not historical facts are based on current expectations and involve risks, uncertainties and other factors that may cause actual results, performance or achievements to be materially different from any future results. While investing in the mining industry is inherently risk, CPM believes that under a professionally managed portfolio approach with the guidance of Quinton Hennigh, PhD, CPM’s full-time Geologic and Technical Director, and our proprietary exploration and mining model, we will be able to generate long-term capital appreciation.
These opinions are current opinions as of the date appearing in the relevant material and are subject to change without notice. The information contained in the letters is based on publicly available information with respect to the Issuers as of the date of such white papers and has not been updated since such date.
This letter is not intended to be, nor should it be construed as, an offer to sell or a solicitation of an offer to buy any security. The information provided in this letter is not intended as investment advice or recommendation to buy or sell any type of investment, or as an opinion on, or a suggestion of, the merits of any particular investment strategy.
This letter is not intended to be, nor should it be construed as, a marketing or solicitation vehicle for CPM or its Funds. The information herein does not provide a complete presentation of the investment strategies or portfolio holdings of the Funds and should not be relied upon for purposes of making an investment or divestment decision with respect to the Funds. Those who are considering an investment in the Funds should carefully review the relevant Fund’s offering memorandum and the information concerning CPM, including its SEC Form ADV Brochure which is available at: www.adviserinfo.sec.gov.
This presentation should not be construed as legal, tax, investment, financial or other advice. It does not have regard to the specific investment objective, financial situation, suitability, or the particular need of any specific person who may receive this presentation and should not be taken as advice on the merits of any investment decision. The views expressed in this presentation represent the opinions of CPM and are based on publicly available information with respect to the Issuer. CPM recognizes that there may be confidential information in the possession of the Issuer that could lead the Issuer to disagree with CPM’s conclusions.
CPM currently beneficially owns, and/or has an economic interest in, shares of the Issuers discussed in these letters. Therefore, CPM’s clients, principals and employees may stand to realize significant gains or losses if the price of the companies’ securities move. After the publication or posting of any video, CPM, its principals and employees will continue transacting in the securities discussed, and may be long, short or neutral at any time thereafter regardless of their initial position or recommendation. While certain individuals affiliated with CPM are current or former directors of certain of the Issuers referred to herein, none of the information contained in this presentation or otherwise provided to you is derived from non-public information of such publicly traded companies. CPM has not sought or obtained consent from any third party to use any statements or information indicated herein that have been obtained or derived from statements made or published by such third parties.
The estimates, projections, pro forma information and potential impact of CPM’s analyses set forth herein are based on assumptions that CPM believes to be reasonable as of the date of this presentation, but there can be no assurance or guarantee (i) that any of the proposed actions set forth in this presentation will be completed, (ii) that actual results or performance of the Issuer will not differ, and such differences may be material or (iii) that any of the assumptions provided in this presentation are accurate.
All content posted on CPM’s letters including graphics, logos, articles, and other materials, is the property of CPM or others and is protected by copyright and other laws. All trademarks and logos are the property of their respective owners, who may or may not be affiliated with CPM. Nothing contained on CPM’s website or social media networks should be construed as granting, by implication, estoppel, or otherwise, any license or right to use any content or trademark displayed on any site without the written permission of CPM or such other third party that may own the content or trademark displayed on any site.
Performance
Performance data represents past performance, and past performance does not guarantee future results. Performance data is subject to revision following each monthly reconciliation and/or annual audit. Individual performance may be lower or higher than the performance data presented. The currency used to express performance is U.S. dollars. Before January 1, 2003, the results reflect accounts managed at a predecessor firm.
1 – Fund net performance is calculated based upon an unrestricted, full fee-paying “Main Class” investor who came in at inception and is eligible to invest in new issues. Investment results shown are for taxable and taxexempt accounts. Any possible tax liabilities incurred by the taxable accounts are not reflected in net performance. An actual client’s results may vary due to the timing of capital transactions, high watermarks, and performance. Performance results reflect the deduction of advisory fees, incentive fees, brokerage commissions, and other expenses that a client would have paid, and includes the reinvestment of dividends and other earnings.
2 – The SMA composites include all accounts that are managed according to CPM’s precious metals or large cap SMA strategy over which it has full discretion. Investment results shown are for taxable and tax-exempt accounts. Any possible tax liabilities incurred by the taxable accounts are not reflected in net performancePerformance results are time weighted and reflect the deduction of advisory fees, brokerage commissions, and other expenses that a client would have paid, and includes the reinvestment of dividends and other earnings.
Risks of Investment Securities: Diversity in holdings is an important aspect of risk management, and CPM works to maintain a variety of themes and equity types to capitalize on trends and abate risk. CPM invests in a wide range of securities depending on its strategies, as described above, including but not limited to long equities, short equities, mutual funds, ETFs, commodities, commodity futures contracts, currency futures contracts, fixed income futures contracts, private placements, precious metals, and options on equities, bonds and futures contracts. The investment portfolios advised or sub-advised by CPM are not guaranteed by any agency or program of the U.S. or any foreign government or by any other person or entity. The types of securities CPM buys and sells for clients could lose money over any timeframe. CPM’s investment strategies are intended primarily for long-term investors who hold their investments for substantial periods of time. Prospective clients and investors should consider their investment goals, time horizon, and risk tolerance before investing in CPM’s strategies and should not rely on CPM’s strategies as a complete investment program for all of their investable assets. Of note, in cases where CPM pursues an activist investment strategy by way of control or ownership, there may be additional restrictions on resale including, for example, volume limitations on shares sold. When CPM’s private investment funds or SMA strategies invest in the precious metals mining industry, there are particular risks related to changes in the price of gold, silver and platinum group metals. In addition, changing inflation expectations, currency fluctuations, speculation, and industrial, government and global consumer demand; disruptions in the supply chain; rising product and regulatory compliance costs; adverse effects from government and environmental regulation; world events and economic conditions; market, economic and political risks of the countries where precious metals companies are located or do business; thin capitalization and limited product lines, markets, financial resources or personnel; and the possible illiquidity of certain of the securities; each may adversely affect companies engaged in precious metals mining related businesses. Depending on market conditions, precious metals mining companies may dramatically outperform or underperform more traditional equity investments. In addition, as many of CPM’s positions in the precious metals mining industry are made through offshore private placements in reliance on exemption from SEC registration, there may be U.S. and foreign resale restrictions applicable to such securities, including but not limited to, minimum holding periods, which can result in discounts being applied to the valuation of such securities. In addition, the fair value of CPM’s positions in private placements cannot always be determined using readily observable inputs such as market prices, and therefore may require the use of unobservable inputs which can pose unique valuation risks. Furthermore, CPM’s private investment funds and SMA strategies may invest in stocks of companies with smaller market capitalizations. Small- and medium-capitalization companies may be of a less seasoned nature or have securities that may be traded in the over-the-counter market. These “secondary” securities often involve significantly greater risks than the securities of larger, better-known companies. In addition to being subject to the general market risk that stock prices may decline over short or even extended periods, such companies may not be well-known to the investing public, may not have significant institutional ownership and may have cyclical, static or only moderate growth prospects. Additionally, stocks of such companies may be more volatile in price and have lower trading volumes than larger capitalized companies, which results in greater sensitivity of the market price to individual transactions. CPM has broad discretion to alter any of the SMA or private investment fund’s investment strategies without prior approval by, or notice to, CPM clients or fund investors, provided such changes are not material.
Benchmarks
HFRX GLOBAL HEDGE FUND INDEX. The HFRX Global Hedge Fund Index represents a broad universe of hedge funds with the capability to trade a range of asset classes and investment strategies across the global securities markets. The index is weighted based on the distribution of assets in the global hedge fund industry. It is a tradeable index of actual hedge funds. It is a suitable benchmark for the Crescat Global Macro private fund which has also traded in multiple asset classes and applied a multi-disciplinary investment process since inception.
HFRX EQUITY HEDGE INDEX. The HFRX Equity Hedge Index represents an investable index of hedge funds that trade both long and short in global equity securities. Managers of funds in the index employ a wide variety of investment processes. They may be broadly diversified or narrowly focused on specific sectors and can range broadly in terms of levels of net exposure, leverage employed, holding periods, concentrations of market capitalizations and valuation ranges of typical portfolios. It is a suitable benchmark for the Crescat Long/Short private fund, which has also been predominantly composed of long and short global equities since inception.
PHILADELPHIA STOCK EXCHANGE GOLD AND SILVER INDEX. The Philadelphia Stock Exchange Gold and Silver Index is the longest running index of global precious metals mining stocks. It is a diversified, capitalization-weighted index of the leading companies involved in gold and silver mining. It is a suitable benchmark for the Crescat Precious Metals private fund and the Crescat Precious Metals SMA strategy, which have also been predominately composed of precious metals mining companies involved in gold and silver mining since inception.
S&P 500 INDEX. The S&P 500 Index is perhaps the most followed stock market index. It is considered representative of the U.S. stock market at large. It is a market cap-weighted index of the 500 largest and most liquid companies listed on the NYSE and NASDAQ exchanges. While the companies are U.S. based, most of them have broad global operations. Therefore, the index is representative of the broad global economy. It is a suitable benchmark for the Crescat Global Macro and Crescat Long/Short private funds, and the Large Cap and Precious Metals SMA strategies, which have also traded extensively in large, highly liquid global equities through U.S.-listed securities, and in companies Crescat believes are on track to achieve that status. The S&P 500 Index is also used as a supplemental benchmark for the Crescat Precious Metals private fund and Precious Metals SMA strategy because one of the long-term goals of the precious metals strategy is low correlation to the S&P 500.
References to indices, benchmarks or other measures of relative market performance over a specified period of time are provided for your information only. Reference to an index does not imply that the fund or separately managed account will achieve returns, volatility or other results similar to that index. The composition of an index may not reflect the manner in which a portfolio is constructed in relation to expected or achieved returns, portfolio guidelines, restrictions, sectors, correlations, concentrations, volatility or tracking.
Separately Managed Account (SMA) disclosures: The Crescat Large Cap Composite and Crescat Precious Metals Composite include all accounts that are managed according to those respective strategies over which the manager has full discretion. SMA composite performance results are time-weighted net of all investment management fees and trading costs including commissions and non-recoverable withholding taxes. Investment management fees are described in CPM’s Form ADV 2A. The manager for the Crescat Large Cap strategy invests predominantly in equities of the top 1,000 U.S. listed stocks weighted by market capitalization. The manager for the Crescat Precious Metals strategy invests predominantly in a global all-cap universe of precious metals mining stocks.
Hedge Fund disclosures: Only accredited investors and qualified clients will be admitted as limited partners to a CPM hedge fund. For natural persons, investors must meet SEC requirements including minimum annual income or net worth thresholds. CPM’s hedge funds are being offered in reliance on an exemption from the registration requirements of the Securities Act of 1933 and are not required to comply with specific disclosure requirements that apply to registration under the Securities Act. The SEC has not passed upon the merits of or given its approval to CPM’s hedge funds, the terms of the offering, or the accuracy or completeness of any offering materials. A registration statement has not been filed for any CPM hedge fund with the SEC. Limited partner interests in the CPM hedge funds are subject to legal restrictions on transfer and resale. Investors should not assume they will be able to resell their securities. Investing in securities involves risk. Investors should be able to bear the loss of their investment. Investments in CPM’s hedge funds are not subject to the protections of the Investment Company Act of 1940.
Investors may obtain the most current performance data, private offering memoranda for CPM’s hedge funds, and information on CPM’s SMA strategies, including Form ADV Part 2 and 3, by contacting Linda Smith at (303) 271-9997 or by sending a request via email to lsmith@crescat.net. See the private offering memorandum for each CPM hedge fund for complete information and risk factors.
