Investors in US Treasury bonds have experienced extraordinary losses in the post-Covid stimulus era as evidenced by the iShares 20+ Year Treasury Bond ETF (Ticker: TLT) which is down 47% on a total return basis from its August 2020 high. Such a large drawdown in a supposedly safe asset class led to several bank failures in early 2023, but the full ripple effects have yet to spill over to other large, richly valued segments of equity and corporate bond markets and to the broader economy. In our analysis, further shock waves lie directly ahead.
The equities most at risk in our view fall into three main thematic buckets: (1) mega-cap tech, (2) leveraged financial services businesses holding potentially overvalued and mismarked assets, and (3) companies facing new earnings headwinds from debt refinancings and an emerging profit margin squeeze. Meanwhile, the fixed-income securities most likely to get caught up in downside contagion in our analysis are sub-investment-grade corporate bonds.
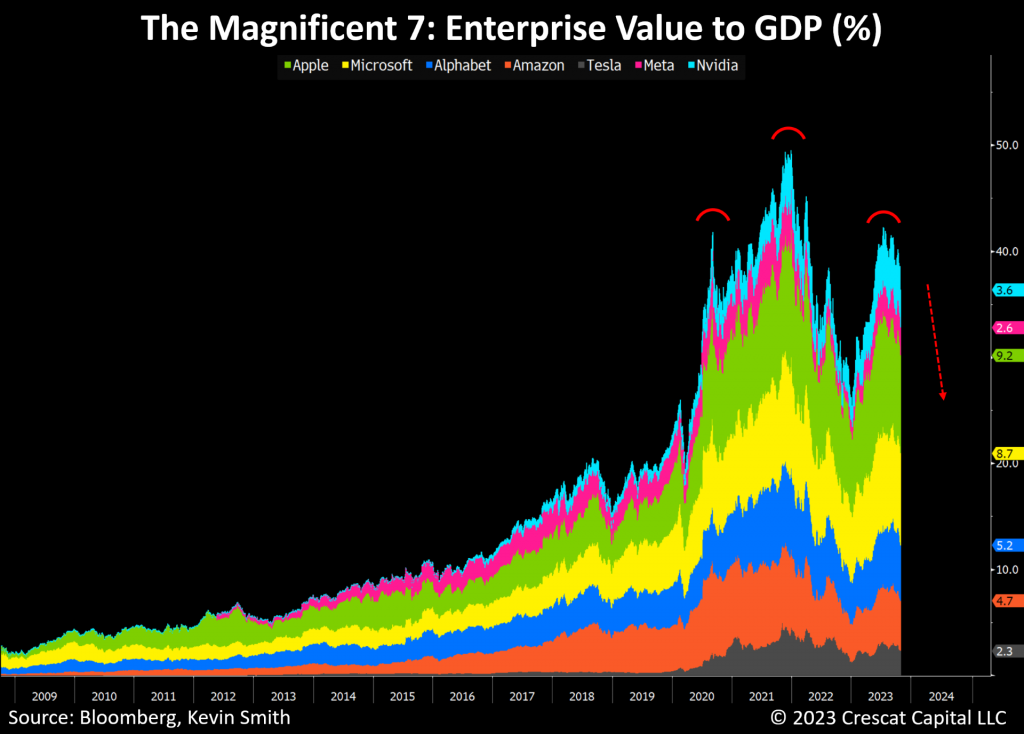
By far, the biggest risk of getting caught up in an implosive chain reaction in our analysis is a tightly packed nucleus of stocks dubbed “The Magnificent 7”. These stocks are a bubble that is ripe to burst based on all our various modeling approaches which reveal lofty valuations that are simply not justified by underlying future growth potential. Note the bearish technical head-and-shoulders pattern in the fundamental valuation chart below which is based on the aggregate Enterprise Value to GDP.
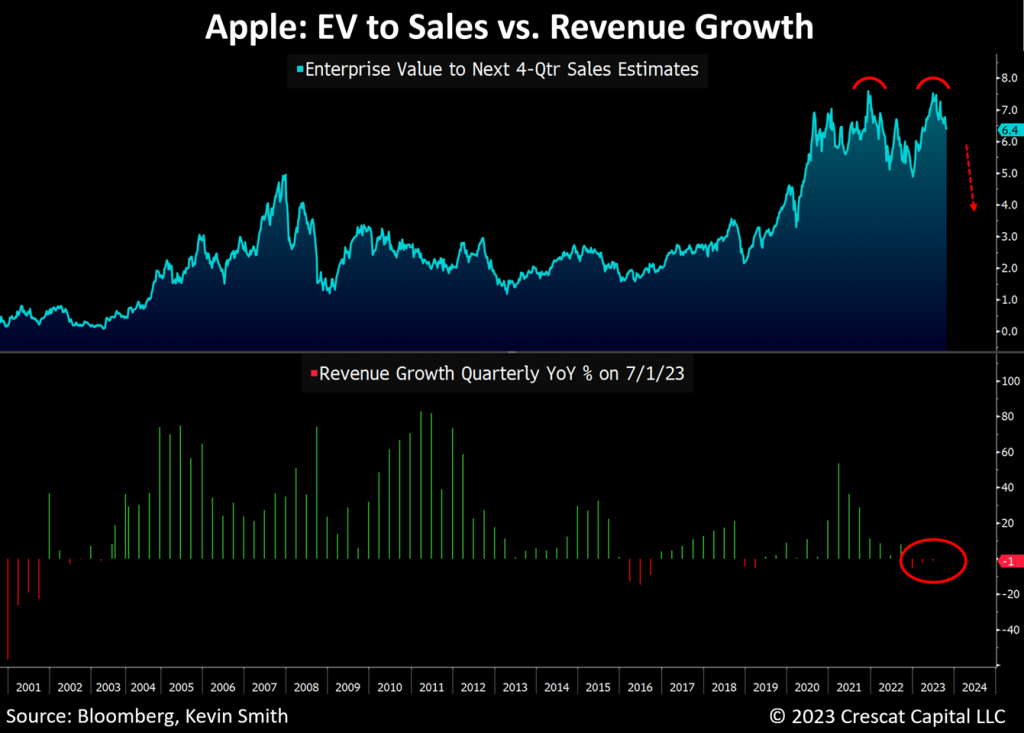
As another valuation case in point, we contend that Apple’s excessive EV-to-revenue multiple is not justified at all based on the company’s currently non-existent sales growth which we show in the chart below. At this stage of the economic cycle, we think the company’s diminished sales growth trend is much more indicative of a ceiling on its future growth prospects than a floor. The company’s valuation meanwhile appears to be flashing an irrationally exuberant and worrisome double top.
In our opinion, too many investors at large are chasing a backward-looking dream by crowding into overvalued securities that represent what worked in the last business cycle, not what has a much higher probability of working in the next one.
This has already proven to be a terrible strategy for government bond investors in the still-shifting macro landscape. We think the recent Magnificent 7 rally is at least giving equity investors a second chance to avoid that mistake.
The S&P 500 topped on January 4, 2022, but in 2023 there has been a retest of those highs driven by a narrow number of ultra-large and richly valued technology companies. This retest now appears to be failing. The Magnificent 7 were indeed the big winners of the last cycle, but there is much froth still to come out of their stock prices potentially driving an S&P 500 and Nasdaq 100 market crash and an economic hard landing.
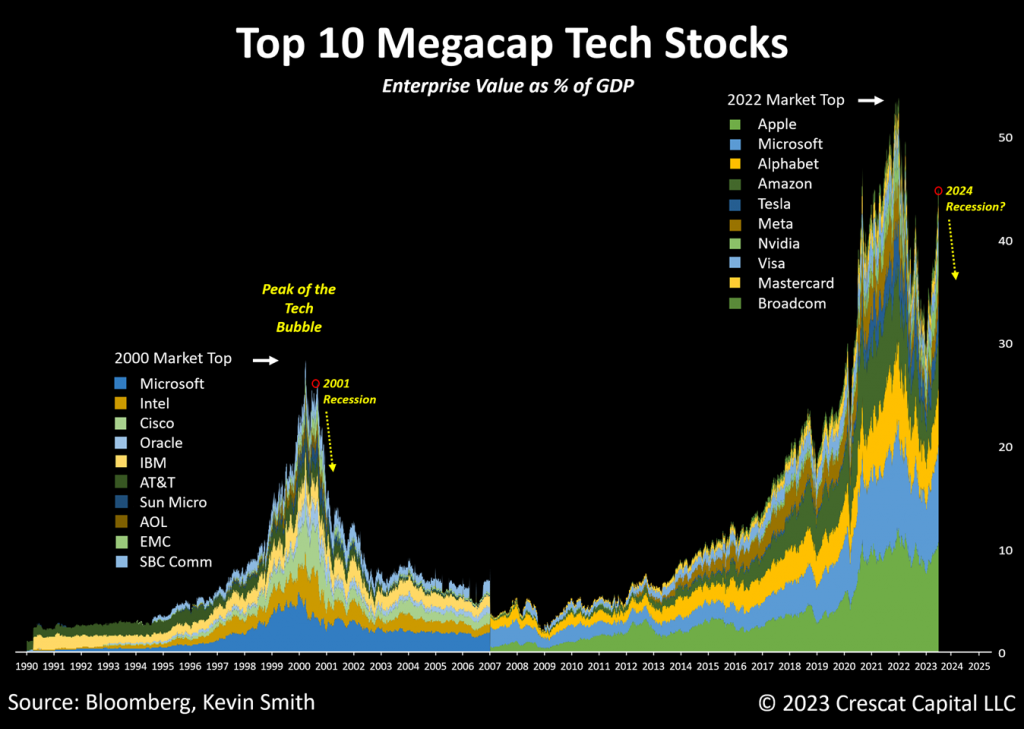
As one can see in the chart below, we believe the risk is that we are headed down from the top of an even bigger large-cap tech stock speculative mania than the one that ended the economic cycle of the 1990s. One can also see that there is much further downside ahead as today’s analogous companies to those of the 2000 tech bubble stand to lose an even bigger share of GDP than their counterparts. Keep in mind that a plethora of new VC-financed technology companies with AI-focused disruptor business models are now targeting these incumbent behemoths. Also, beware that the US and foreign governments are aggressively pursuing anti-trust and consumer protection legal actions against these companies which will likely significantly impair their future market share and profitability.
The biggest lesson from both the 1929 and 2000 stock market bubbles is that long periods of speculation combined with high valuations lead to major stock market crashes. We don’t believe this time will be any different.
Downside Risk in Junk Bonds
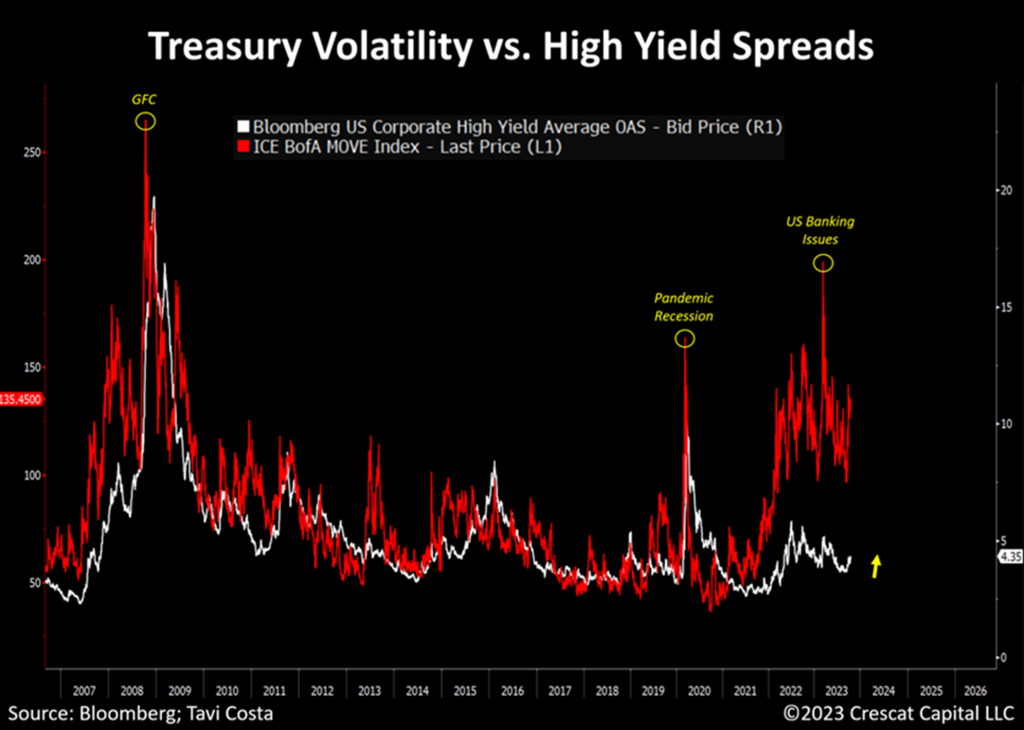
On the fixed income side, we anticipate an impending volatility event as forecasted by the divergence in the BofA MOVE Index of Treasury volatility compared to high-yield credit spreads as shown in the chart below.
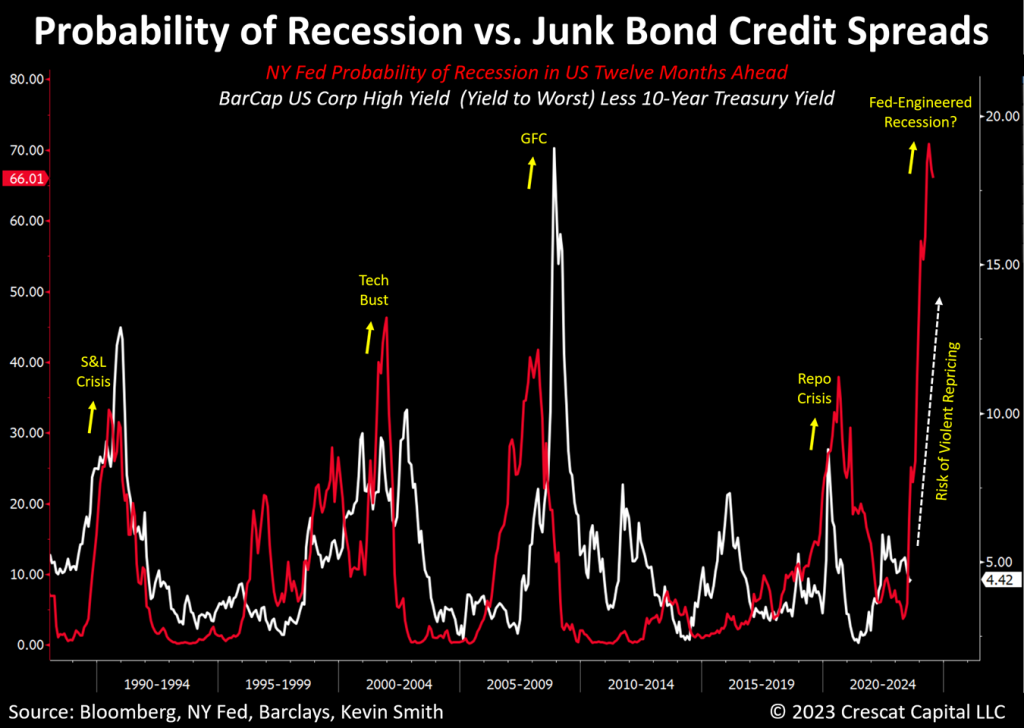
The NY Fed’s own Probability of Recession Twelve Months Ahead model is forecasting a historically high probability of an economic contraction. As shown in the chart below, this indicator normally signals an impending violent downward repricing in the junk bond market which we believe could be directly ahead.
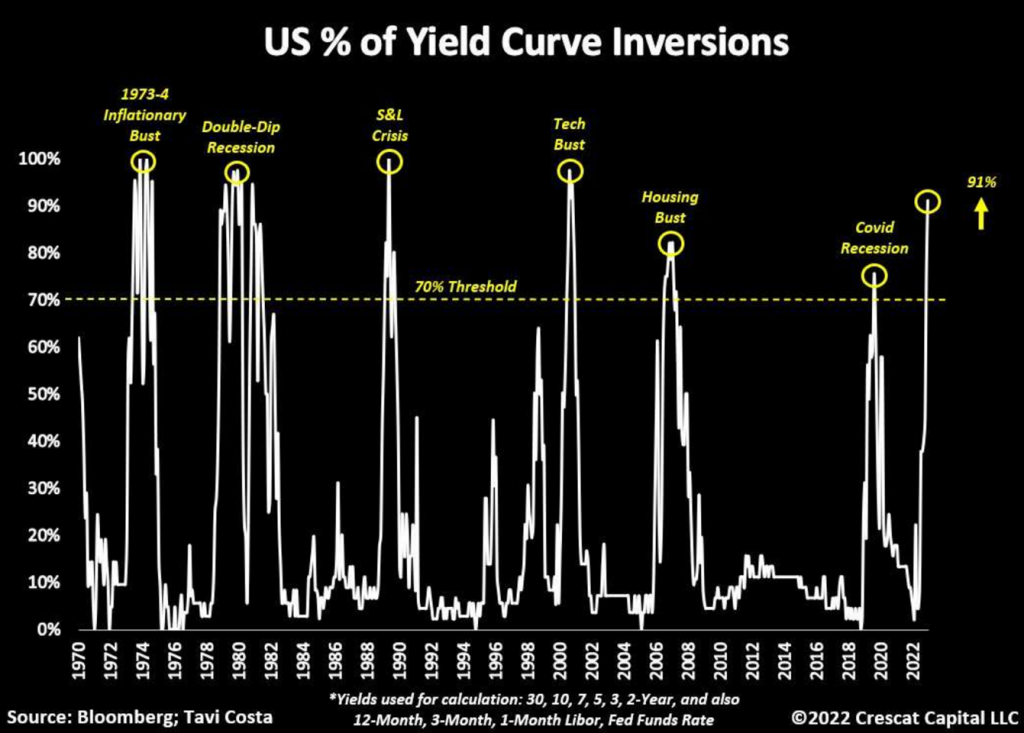
Also, as shown in the chart below, our own more comprehensive yield curve inversion model than the NY Fed’s warns of an impending high-probability S&P 500 downturn and recession.
An Impossible Trilemma
US Treasury securities are the foundation for all lending in the US and global economy, and their yields impact the valuation of all financial assets. In today’s historically leveraged world, especially in the government and corporate segments of the economy, we want to make it as clear as we possibly can that we believe the recent systemwide upward pressure on the cost of refinancing and issuing new debt instruments, led by the run-up in 10-year Treasury yields, runs the risk of leading to a near-term decline in the S&P 500 Index of up to 20% or more and ultimately a decline of up to 50% or more within 12 to 18 months coinciding with a recession.
The problem today is that the US Treasury Department and Federal Reserve are navigating an impossible trilemma:
- Structural inflationary pressures.
- Lingering financial asset bubbles brought about by a 13-year era of unprecedented zero-interest rate policies (ZIRP).
- Falling demand for US Treasuries in an economy dependent on fiscal expansion and deficit spending.
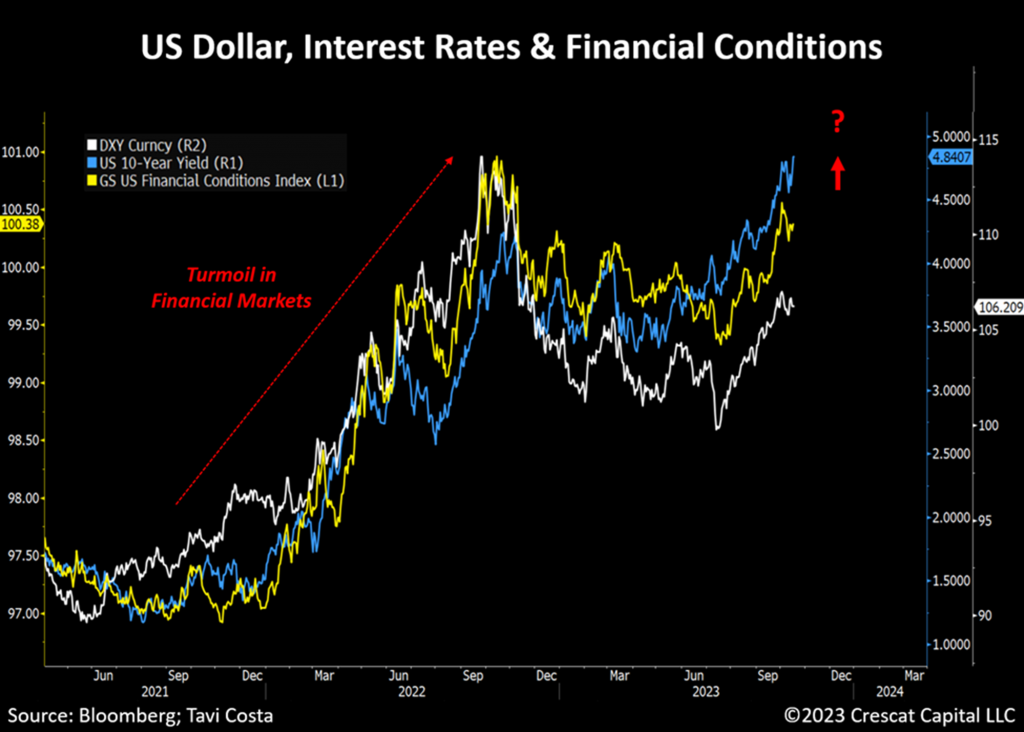
In its effort to re-establish credibility on the inflation-fighting front, the Fed has been forced to adopt an entirely new playbook from the last era. It has signaled that it intends to keep interest rates higher for longer. Meanwhile, the Treasury Department, solely and in opposition to its central bank, has been taking all the policy work of trying to keep the economy expanding onto its own shoulders. In this new macro regime, not only is our monetary authority keeping its short-term Fed funds rate high and still engaged in quantitative tightening, but it is also in support of two other measures of tightening of broad financial conditions including higher ten-year Treasury yields and a stronger dollar.
It is important to note that the two other key components of financial conditions, S&P 500 stock price valuations and credit spreads, have yet to tighten in a meaningful way. As we showed in our analysis above, we think those are two of the next major dominos to fall in the chain reaction.
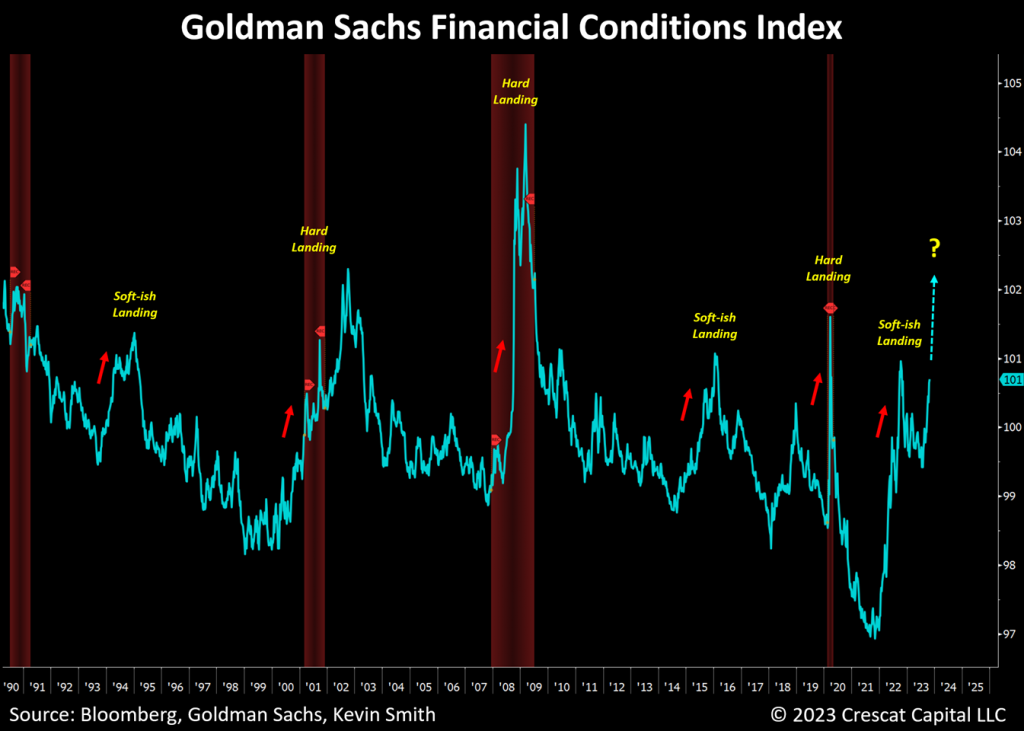
A meaningful decline in the S&P 500 along with a widening of corporate credit spreads, would lead to a further rise in the turquoise line in the chart below, the Goldman Sachs Financial Conditions Index, and therefore a high-probability economic hard landing.
It is important to understand that empirically, a significant tightening of financial conditions has historically led to financial crises and often sharp contractions in real GDP, but rarely if ever, has it led to a soft landing in financial markets.
All the “soft-ish” landings that we have noted in the chart above, while they did not lead to recessions, coincided with significant financial losses in major segments of the markets.
The reason for the absence of a more widespread financial crisis to date, despite the relentless increase in the Fed’s base lending rate, is the extensive debt issuances and refinancings that already took place during Covid when interest rates were much lower. As a result, effective interest rates on the total issued and outstanding debt are still close to historic lows. The problem is that this situation is about to change dramatically because there is a wave of maturities coming due on both the sovereign and corporate debt in the next year that will need to be refinanced at much higher interest rates. In other words, the cost of servicing outstanding debt is poised to surge exerting a material negative impact on the economy.
Great Rotation
The type of economic shift that we believe we are still in the midst of offers the opportunity for a rotation into a still unpopular and undervalued asset class that can actually perform extremely well during the recession and also over the entire next expansionary cycle with the potential for gaining popularity and momentum throughout.
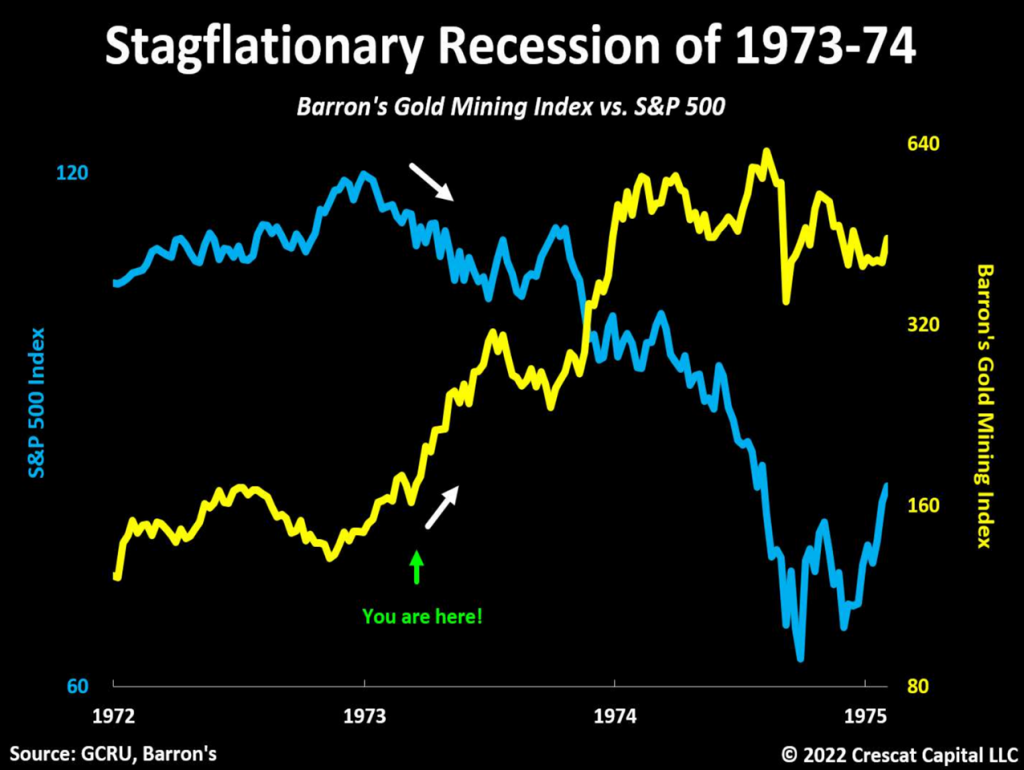
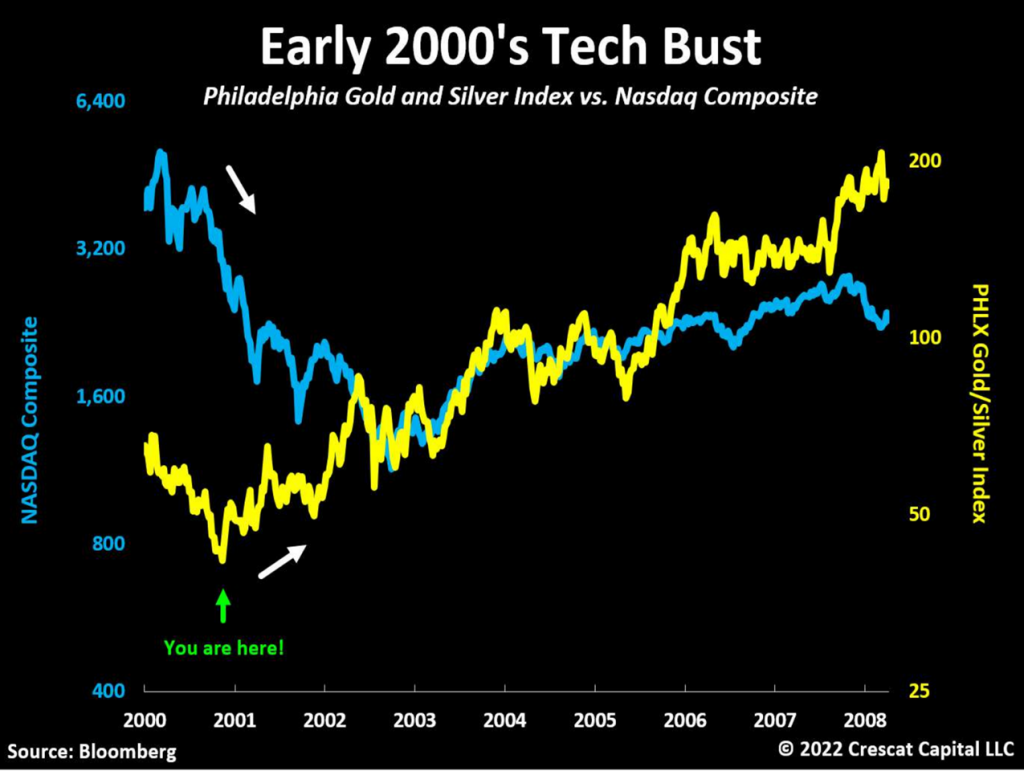
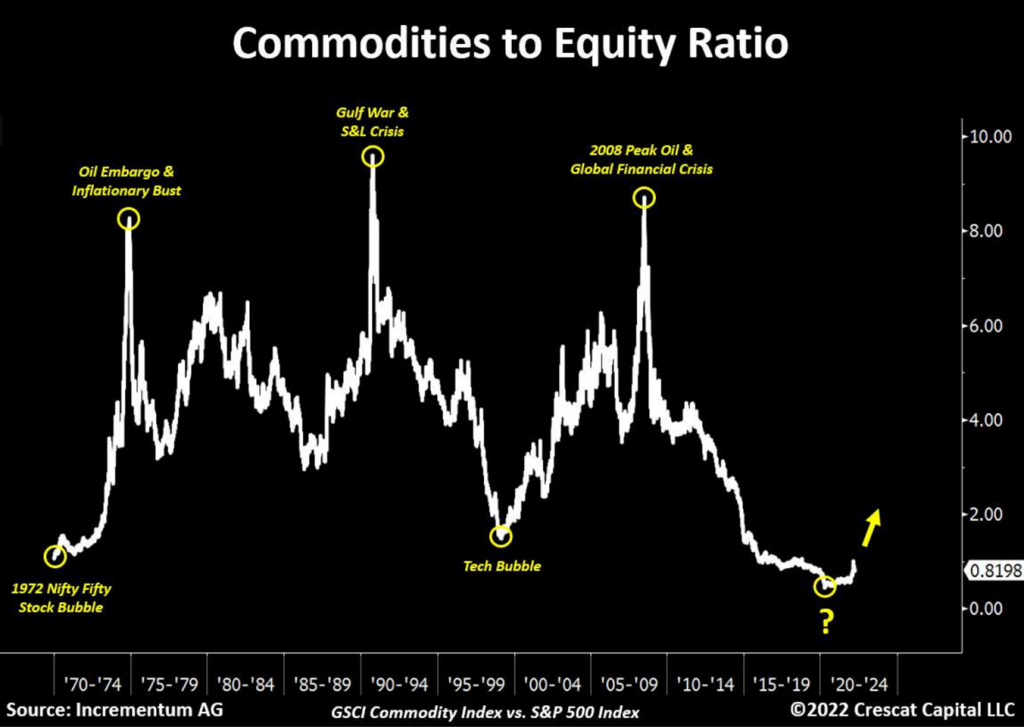
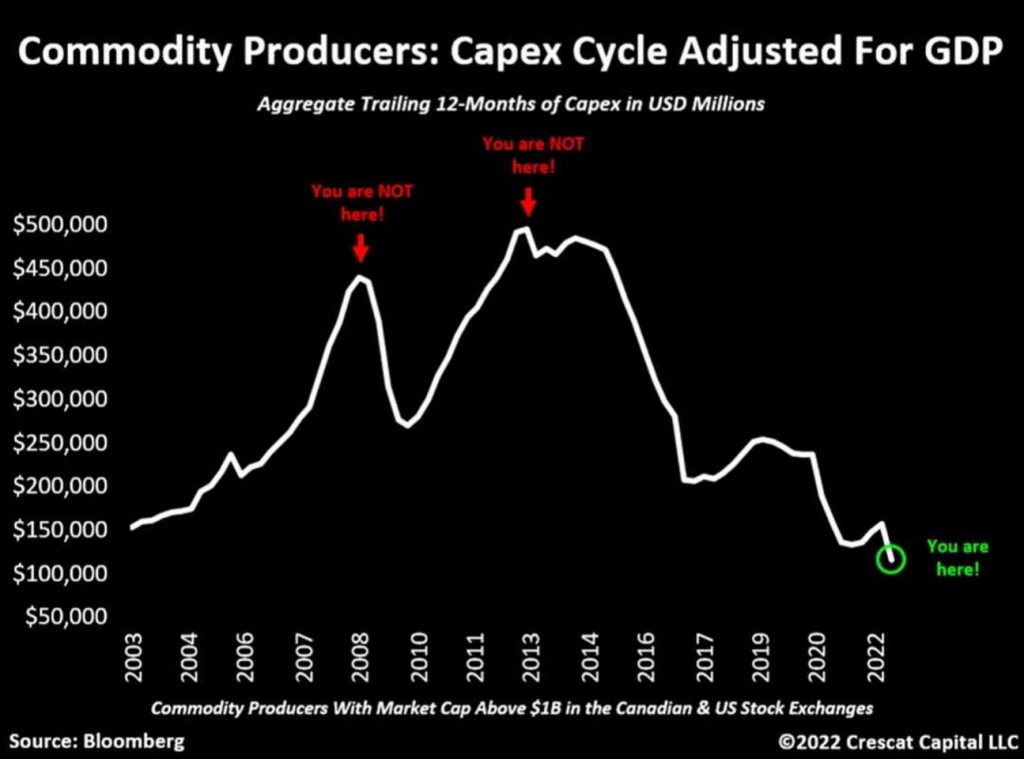
There are two past periods of large-cap growth stock market-led crashes and ensuing recessions that we think investors need to study carefully because they have many similarities to where we are today on a macro level. These two periods were 1973-74 and the early 2000s. They offer an important roadmap for what potentially lies ahead. We encourage you to study the next four charts carefully because they don’t just point out the downside risks for large-cap equities but provide a look at the upside opportunities in the commodity asset class including the potential for an economic cycle favoring gold, broad commodities, and the equities focused on these industries.
In our view, commodity and resource-equity investing offers an exciting low-valuation and high-future-growth alternative to crowded equity and fixed-income investments that worked last cycle but tend to lose some of their luster as we look ahead.
The underinvestment in commodities over the last decade is incredibly bullish for this asset class, which is an entirely different setup than we had during the 2008 Global Financial Crisis. The reason that we point this out is that the experience of the GFC, when commodity prices suffered, tends to scare many people away from being interested in commodities as a hedge against large-cap equities. During that crisis, government bonds were the best-performing asset class. This “recency bias”, which we also refer to as “fighting the last war” help to explain the crowding into Treasury bonds as a potential hedge against the next stock market correction and is one reason Treasury bonds remain highly crowded today even with their recent poor performance.
We are confident that the next expansion cycle will be both fiscally powered and monetarily accommodated. As such, it should be highly favorable for commodity assets. The next expansion should be one with higher-than-ZIRP-era interest rates but one that is also combined with highly inflationary fiscal and monetary policies in an attempt to rapidly grow nominal GDP. Public stimulus programs geared toward infrastructure, manufacturing, and electrification should be a key engine in this effort. In the next expansion, the combination of real growth and inflation should also prove necessary relief to deleveraging unsustainable debt-to-GDP levels.
We believe the era of ZIRP is over and that will mean continued contraction in S&P 500 P/E multiples. At the same, we envision a new epoch of inflation that is only beginning.
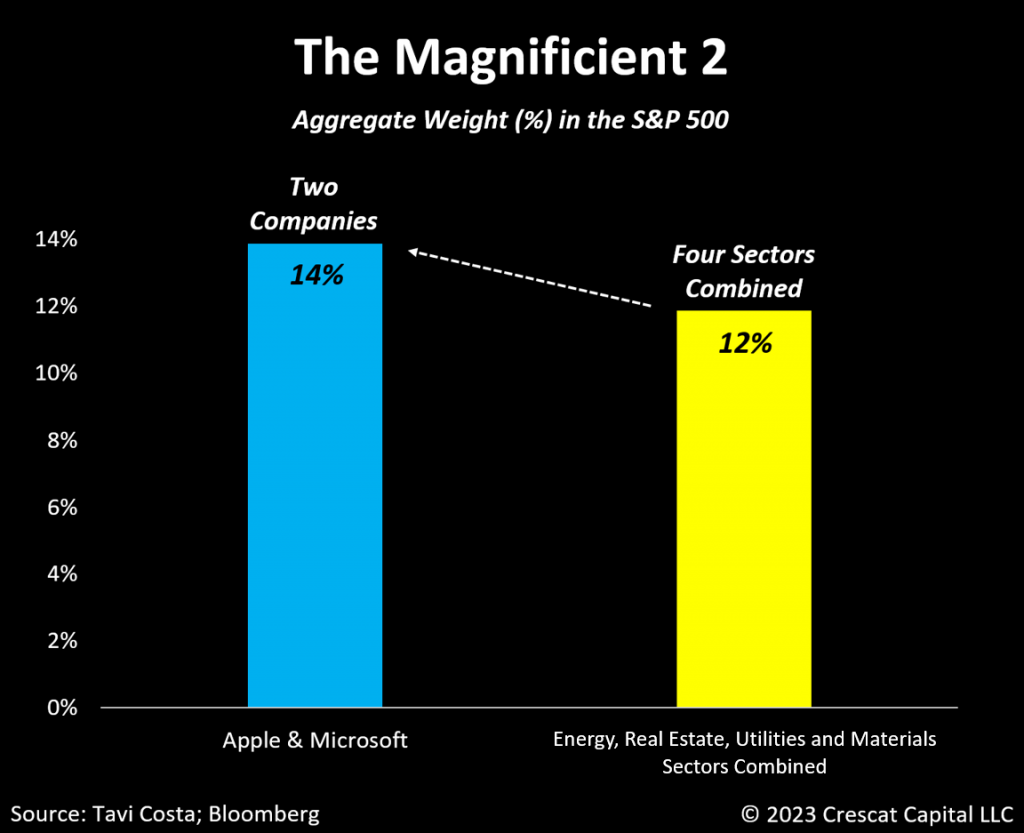
The Magnificent 2
We think investors are being duped if they are buying into the idea of a soft landing in today’s highly leveraged world where financial assets have been artificially boosted by easy money policies that are no longer in force.
On a total return basis, the S&P 500 Index, which is market cap weighted, is still up 8.6% for the year while its equal-weighted version is down 4.0%, the latter being a sign of the likely truer underlying trend in the stock market and the economy.
However, delving deeper into this situation, we discovered that, more troubling than the top 7 largest companies, the top 2 alone can be considered even more concerning.
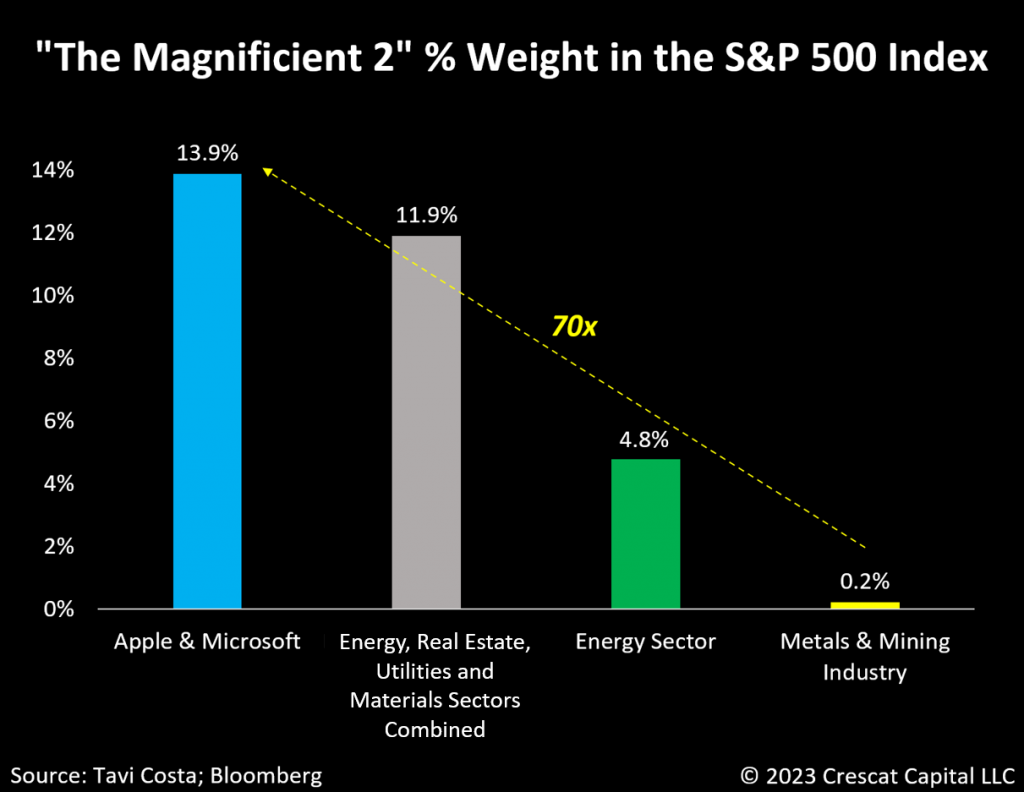
Consider the fact that the aggregate weight of Apple and Microsoft in the S&P 500 index is now larger than 4 sectors combined. In fact, these two companies have been responsible for nearly 40% of the market capitalization gains this year and currently constitute a staggering 21% of the Nasdaq 100 and 14% of the S&P 500.
This level of dominance by two companies in the index is unprecedented and it is crucial to understand that becoming such a significant portion of the market can be incredibly positive on the way up, yet it can also amplify the downward pressure when the market is headed lower.
Forgotten Essential Parts of the Economy
From a different perspective, for all the money flowing into S&P 500 Index funds and ETFs, only 0.2% of that today is going into the metals and mining industry which we believe is an unsustainably depressed level.
We simply cannot bring about the transition to green energy, achieve the re-shoring of developed economies, enhance manufacturing capabilities, modernize electrical grids, boost housing supply and inventory, substantially improve public infrastructure, and expand military efforts, all without making metals and mining a significantly more relevant part of the economy.
During inflationary regimes, one must strive to invest in companies with pricing power to navigate the macro investment climate. Resource companies, despite facing increased operating costs, have inherent revenue growth and margin expansion opportunities in their businesses as the underlying commodities they sell face inelastic or growing demand amidst constrained industry-wide supplies.
Commodity prices tend to perform exceptionally well during such periods, but earnings and stock prices of commodity producers can do even better due to operating leverage from past fixed-cost investments. At the same time, higher interest rates make it more challenging for some commodity producers to invest in fixed assets which can restrict industry-wide supply and elongate the commodity bull market cycle.
A Dangerous Combination
The impact of increasing interest rates has the potential to significantly harm the economy independently. However, when that coincides with the tightening of monetary conditions and the sharp appreciation of the dollar, it creates a perfect storm that poses a substantial threat to speculatively valued financial assets. This very combination of macro factors contributed to the sharp decline in broad equity markets, especially in technology growth stocks, from 2021 to late 2022.
It is important to note that micro and small-cap stocks have already seen a decline of 40% and 30%, respectively another leading indicator that does not speak well for the health of the overall economy while also speaking to the opportunity in small-cap mining stocks.
The recent poor performance of government bonds along with the narrowing leadership of equity markets are likely preceding a bigger meltdown in large-cap equities and credit.
Back to the 1970s
There is an ongoing debate among macro investors related to past inflationary cycles when comparing the 1940s cycle to that of the 1970s. Some macro strategists have thought that the Fed would keep holding rates down in this cycle, also known as financial repression, so that the current inflationary period would look much more like the 1940s. But the current economic cycle has unfolded much more like the 1970s than the World War II era up to this point. This has been one of the mistakes of Treasury bond investors. To put this into perspective, during the 1940s, the 10-year yield never surpassed 2.5%. Today, we are essentially double that amount and policymakers don’t seem to be worried about it.
In fact, after numerous public statements and appearances, Federal Reserve members have frequently emphasized that the rise in long-term interest rates is helping with their objective of tightening monetary conditions.
Nevertheless, it is very possible that the playbook of the 1940s will inevitably be put into action again given the unsustainable nature of the debt problem and the need for the Fed to suppress interest rates to some degree. The truth going forward will probably be somewhere in between the two comparable decades with rates going up and down but likely staying well above the ZIRP-era level where it was falsely argued that money printing and interest rate suppression do not lead to inflation.
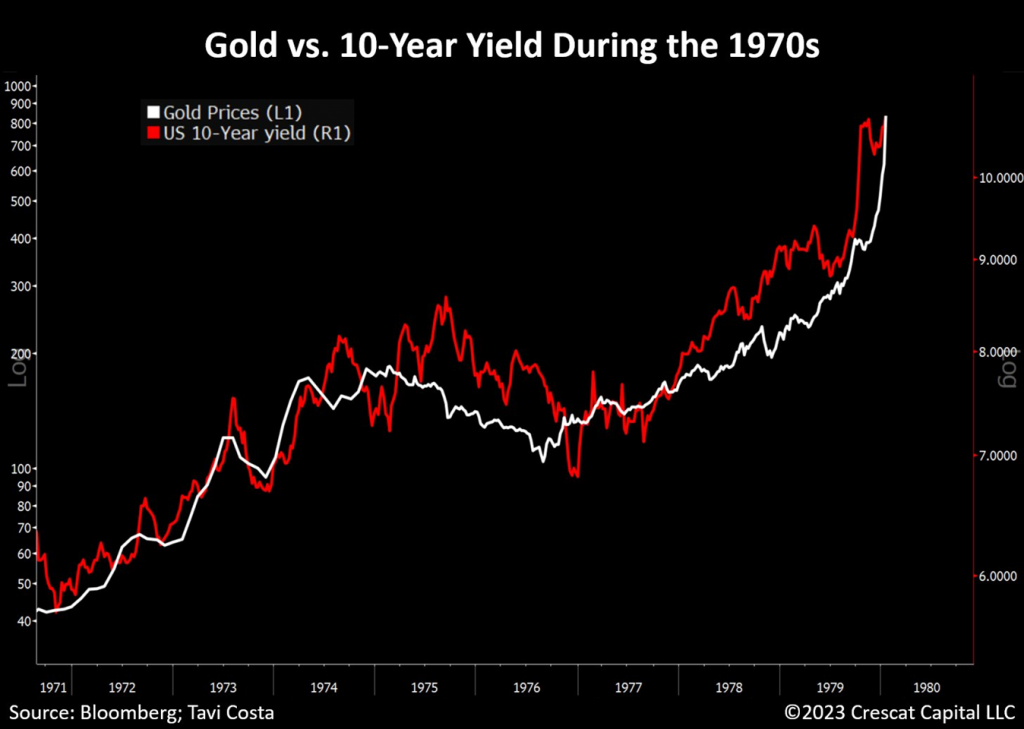
More importantly, regardless of whether you align with the 1940s or 1970s perspective, we think hard assets are imperative for investors to own in the current cycle. Note in the chart below that as yields rose persistently in the 1970s, the price of gold performed extremely well. This is important to understand because many today believe that gold requires a low-interest-rate environment to perform. Indeed, that could not be farther from the truth.
The Lag Effect
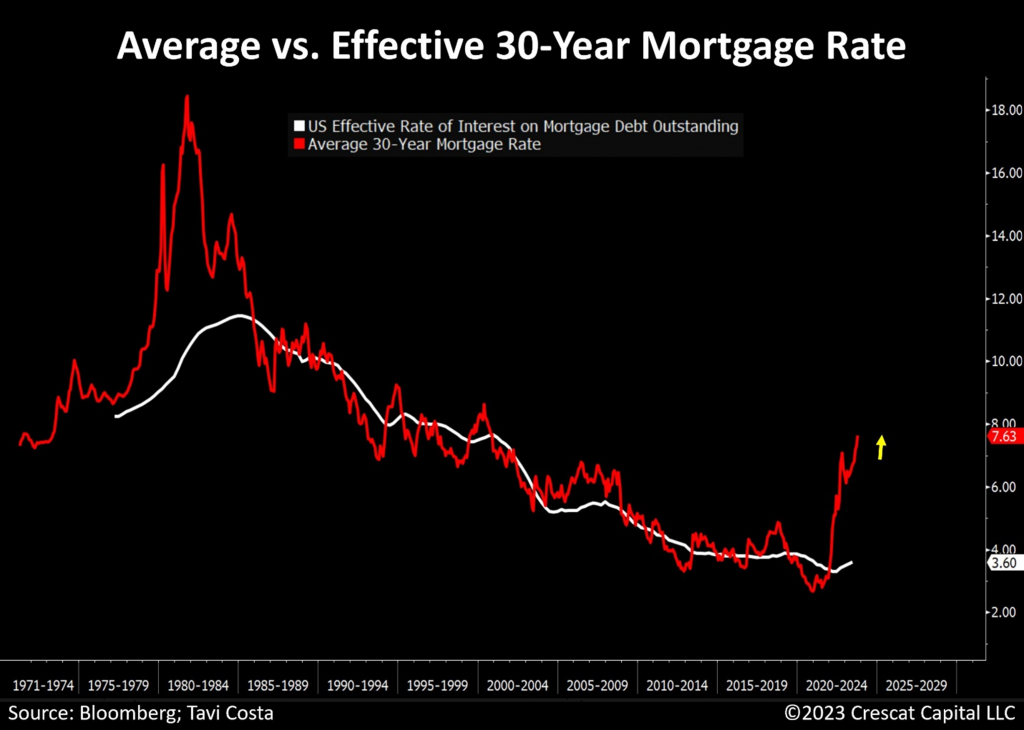
The chart below serves as a compelling illustration that we have not yet experienced the full impact of tighter financial conditions filtering through the economic system. Despite the recent increase in mortgage rates, effective interest rates for most individuals remain at historically low levels.
Corporations are in a similar decent position for now but on the verge of a substantial surge in interest cost as they face a significant wave of debt refinancing in the next 12 to 24 months. Sovereign institutions are also facing a comparable scenario. The US Government, in particular, will need to refinance nearly 50% of its total debt in the next three years at likely substantially higher interest rates.
The Three Waves of Inflation & Valuations
Five key long-term inflationary forces remain deeply rooted in the system largely due to the unintended consequences of the ZIRP era which caused a gross misallocation of capital:
- Insufficient past capital investment in natural resource industries to meet medium-term demand that should drive commodity prices much higher;
- A potentially escalating global wartime economy;
- Ongoing trade deglobalization trends including supply-chain re-shoring;
- Embedded wage-price spirals now surfacing through spreading labor strikes; and
- An economy that is heavily dependent on US government fiscal expansion and deficit spending.
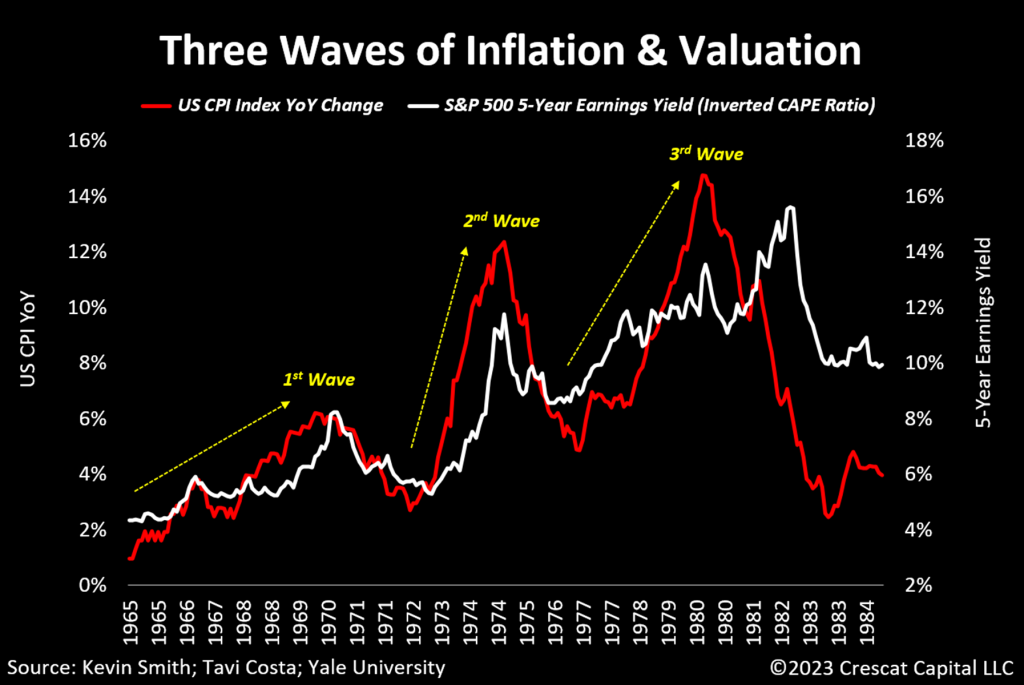
When examining the inflationary trends of the 1970s, it’s interesting to observe that the pattern of overall equity valuations unfolded in a comparable manner. To clarify, as inflation rates accelerated in three elongated waves, the fundamental multiples of the stock market also contracted in three waves, as shown by the increase in the market’s earnings yield.
We may encounter a parallel phenomenon today. It is crucial to acknowledge that current valuations are significantly more extreme than their 1972 starting levels. Additionally, many large US companies are on the brink of a potential earnings decline from unsustainably high levels of profit margins with historically low labor costs. These factors, given the emergence of upward wage pressure, portend a coming stagflationary recession.
A Macro Regime Change
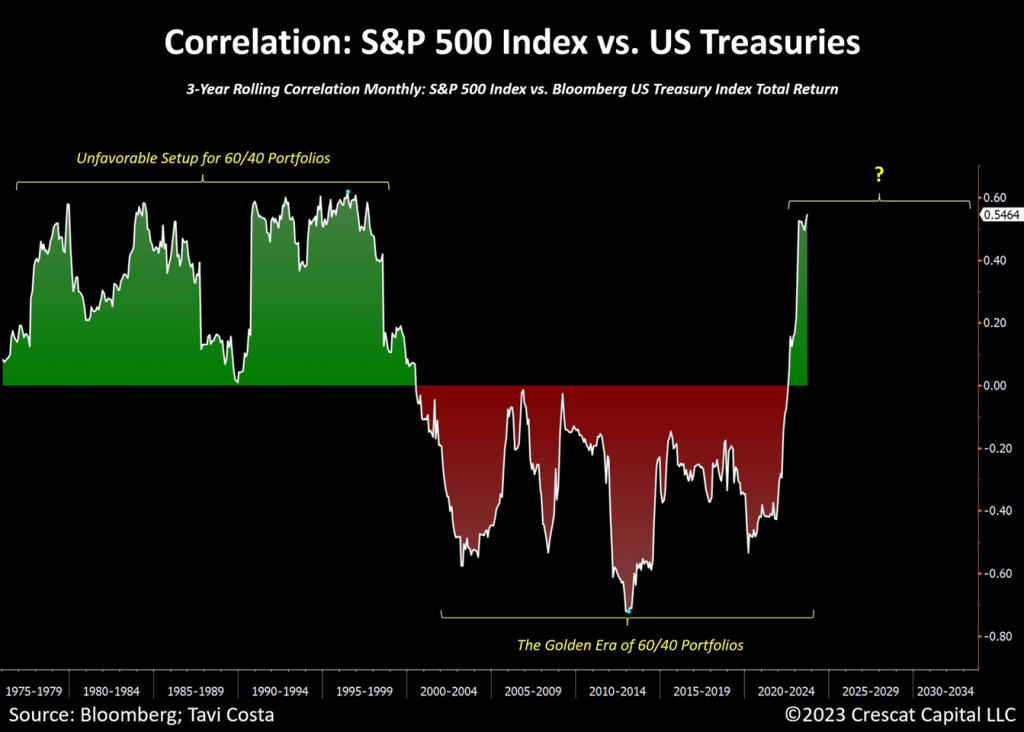
The golden era of 60/40 stock and bond portfolios is likely coming to an end. During periods when these two asset classes have low a correlation, when one asset is not performing well, the other asset has a chance of performing well. However, during times when these assets are highly correlated, they lose their risk-dampening effect. What this means is that there are times when both assets can be declining at the same time. 60/40 investors witnessed this to their dismay in 2022.
When stocks and bonds are more highly correlated, as they have been recently, asset allocators will naturally want to include a new asset class in their portfolios that offers a low or negative correlation to stocks and bonds. That is the role of commodities and resource equity investing today. Because these segments of the market have been out of favor and under-allocated for an extended period, the equities are cheap while the commodities themselves offer favorable supply and demand imbalances that the companies can turn into high future growth opportunities.
Commodities, including critical hard assets like precious and base metals, are likely to be some of the major beneficiaries of the next cycle. We think investors should be adding more commodities to their portfolios now.
A Gap Between Mega and Small Caps
Mega-cap tech companies are not impervious to the business cycle. Today, we think they are the business cycle. In other words, when they break, so should the entire economy.
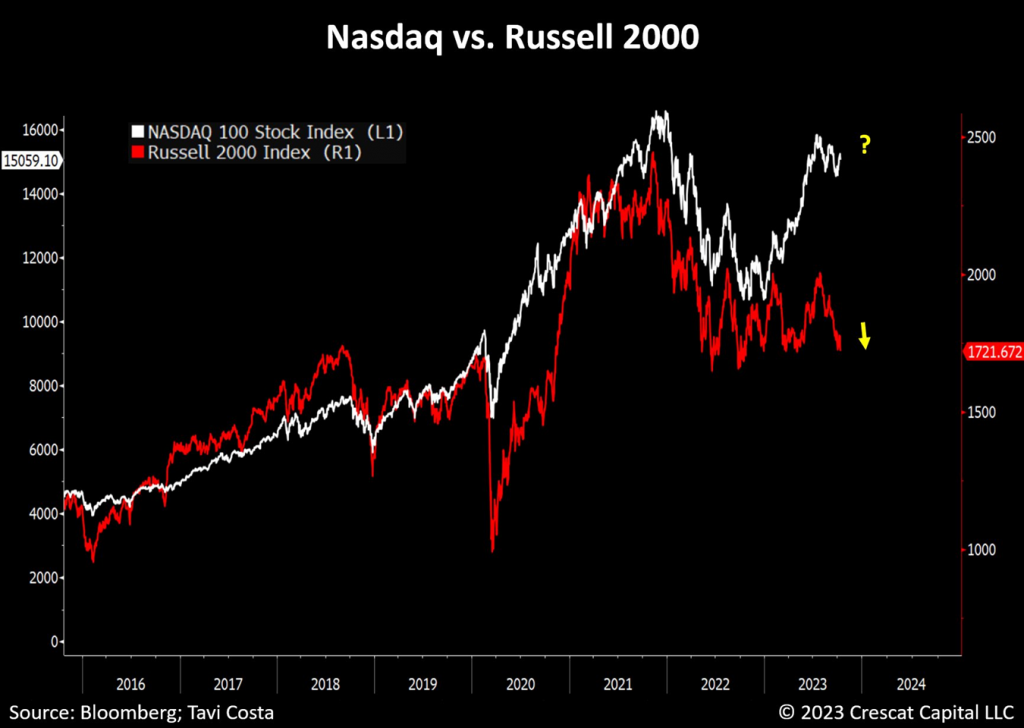
The disconnect between Nasdaq 100 and small-cap stocks demands serious attention. We believe the relatively poor performance of small-cap stocks is already making a statement about a deteriorating economy. The larger caps should soon follow. After a long period of speculation and overvaluation in mega-caps, we are highly concerned that a stock market crash and recession are around the corner.
Double Top
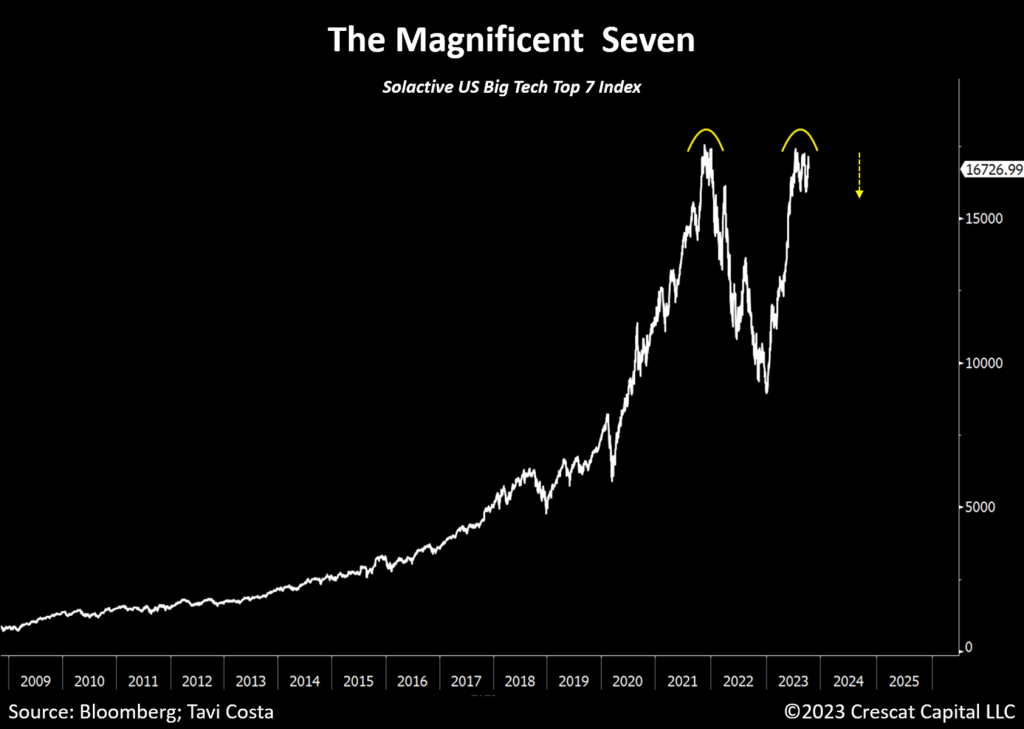
From a technical perspective, the top 7 largest tech stocks are currently staring down a troubling double-top formation which reveals a full re-test of their collective 2021 highs, but this is a test they are likely to fail given all the fundamental and macro headwinds we have already laid out in this letter.
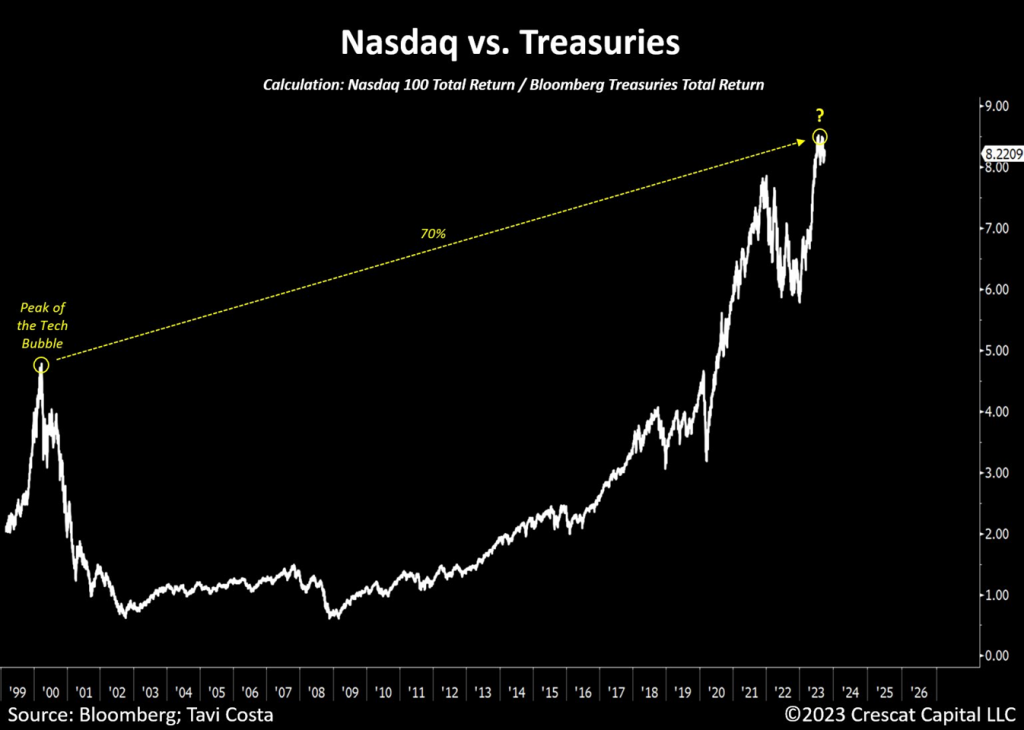
70% Higher Than the Tech Bubble
The current Nasdaq-to-Treasuries ratio stands 70% higher than its level during the tech bubble’s peak. The chart below puts into perspective how, despite losses in Treasury bonds, the more relevant question now is whether overall equities can remain as overvalued as they are in today’s interest rate environment.
Global Fiat Currency Debasement
Gold is starting to sniff that central banks have no alternative in the long run but suppression of interest rates relative to true inflation (AKA financial repression) and that some sort of Fed yield curve control measure will be ultimately unavoidable. The government simply cannot continue exacerbating its debt problem exponentially while the Fed deliberately increases the cost of servicing it.
We are facing a trifecta of macro imbalances: the debt problem of the 1940s, an inflationary era that is similar to the 1970s, and a broad asset valuation imbalance that is reminiscent of the late 1920s and 1990s.
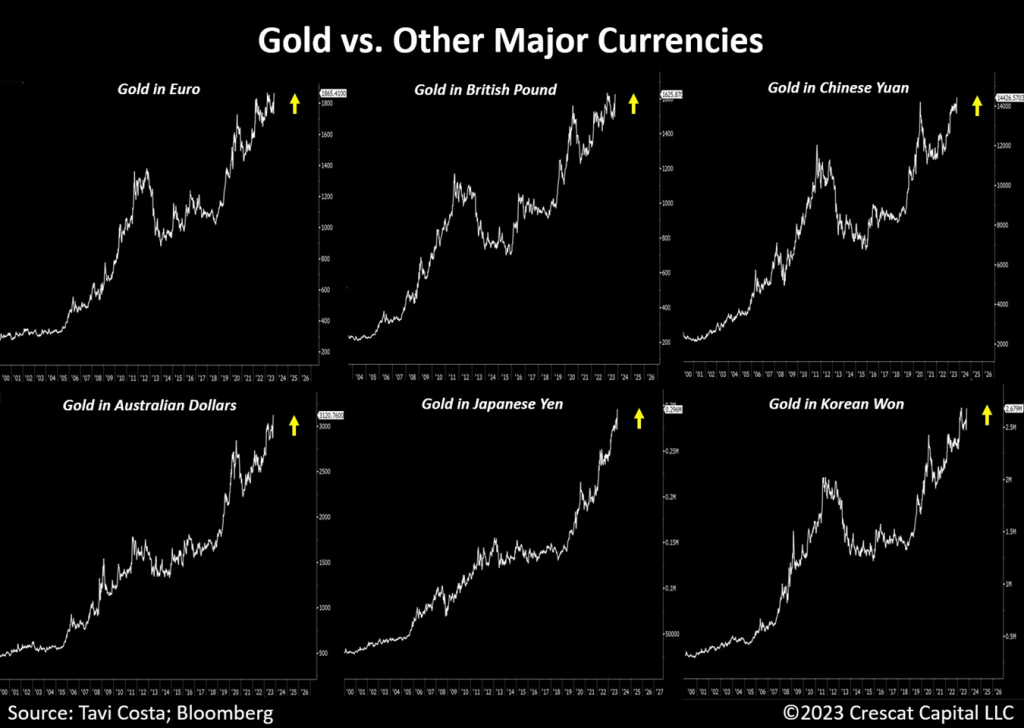
More importantly, note how gold hit record levels in six major currencies. In our strong view, the US dollar is the next one in line to devalue against the metal.
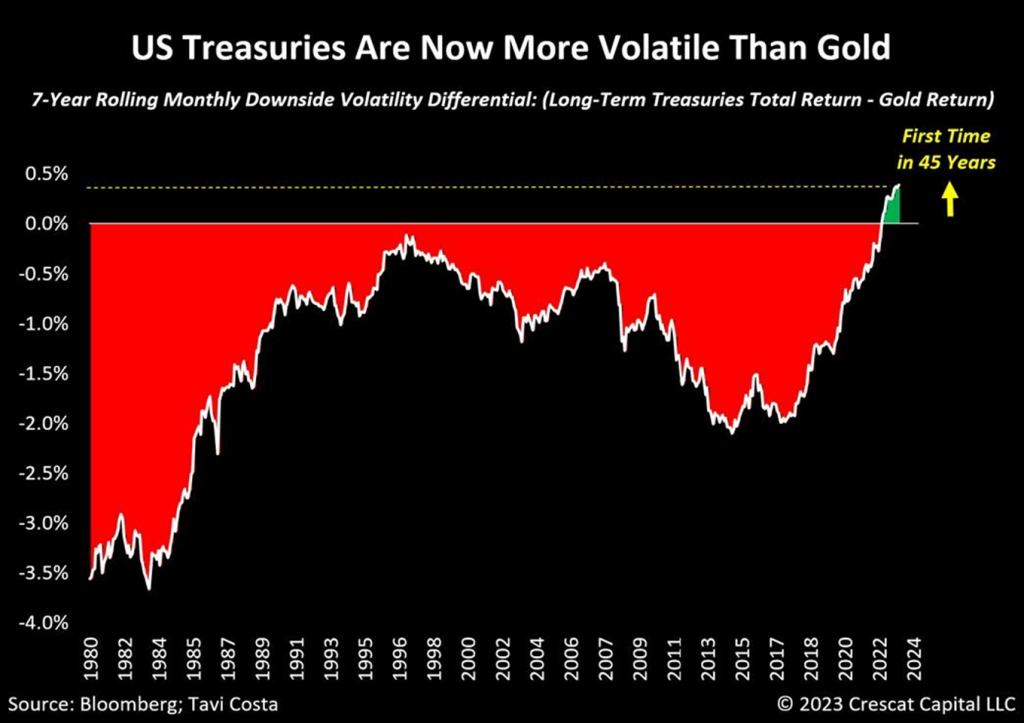
Treasuries Are More Volatile Than Gold
This chart is becoming increasingly more relevant as investors are starting to learn the hard way that US Treasury bonds are no longer necessarily the safest investment alternative, especially in an inflationary environment. Central banks have already recognized this trend and are in the process of enhancing the quality of their international reserves by accumulating hard assets like gold. Asset allocators and investors should probably include gold and other commodities in their portfolios too.
Gold Is a Superior Choice
One must take note of the recent strength in precious metals as Treasuries sell off significantly.
A popular argument against the idea of investing in hard assets in a rising interest rate environment is the notion that it might not be appealing to hold an asset that doesn’t generate any yield. However, that thesis doesn’t necessarily hold water when we look back in history. Hard assets delivered some of their strongest total return performances compared to Treasury bonds during the 1970s during a period of increasing interest rates.
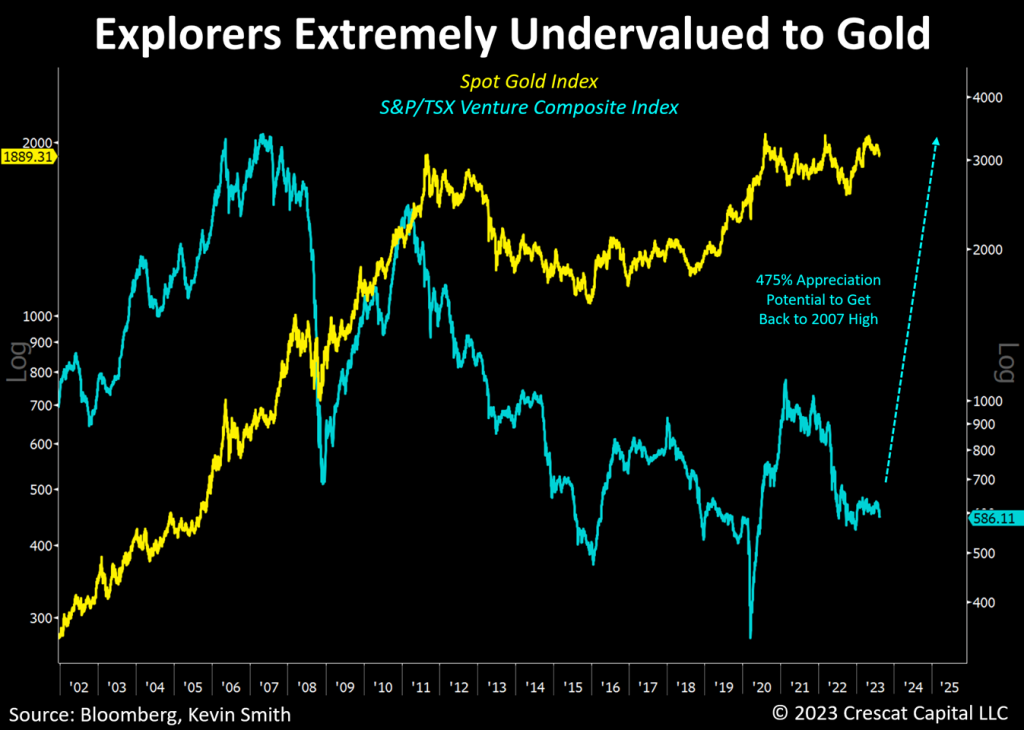
As shown in the chart below, we believe some of the deepest value and highest growth potential in the economic cycle ahead lies in the beaten-down mining exploration segment of the precious and base metals industry.
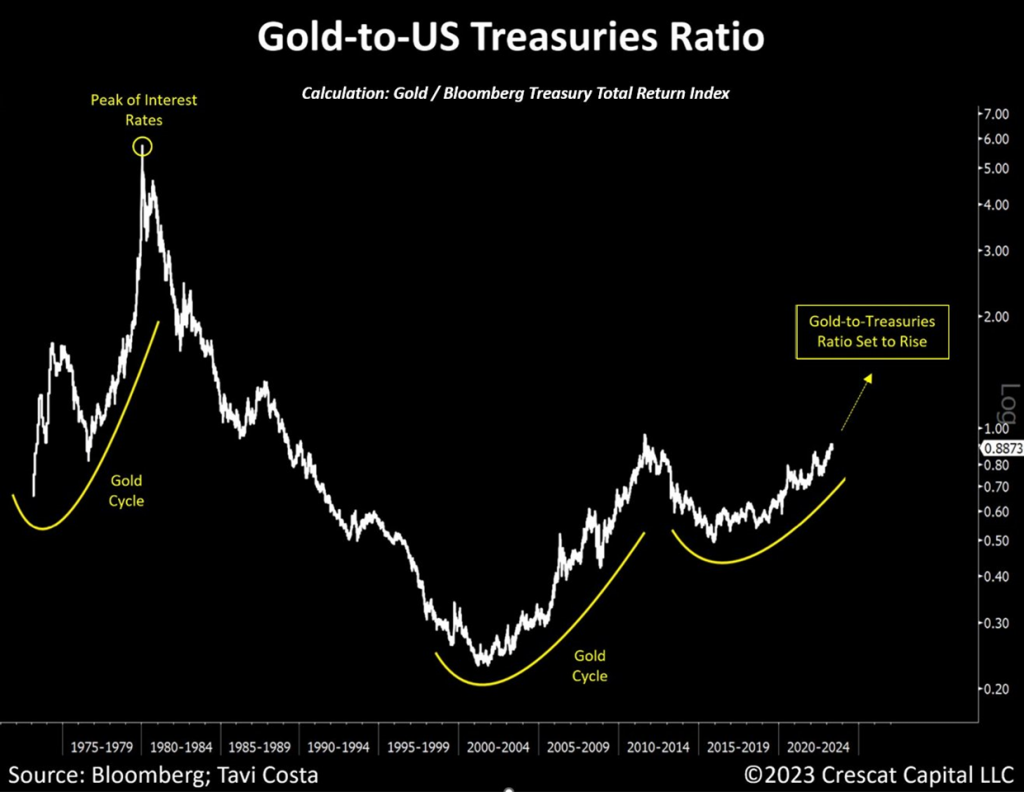
A Gold Cycle Paves the Way for More Opportunities
What’s intriguing, though, is that much like the upward shift in interest rates has yet to impact the system, a continued trend in gold could lay the foundation for a range of other assets to perform well. The first one that comes to mind is silver.
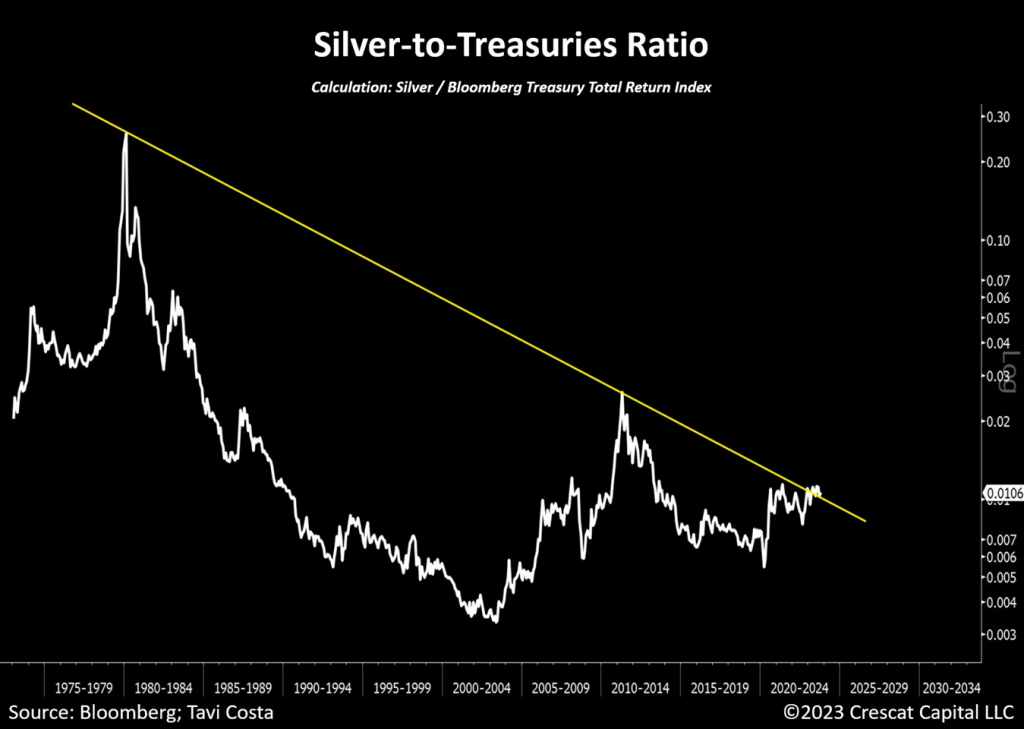
Similar to gold, the silver-to-Treasuries ratio just broke out from a multi-decade resistance. Hard assets are now becoming more appealing to traditional investment strategies that have had minimal to zero exposure to commodities in the past 40 years. This shift in capital allocation is a central driver behind the notable changes in asset correlations and market leadership that we are currently witnessing.
Structurally Bearish on US Treasuries
The next logical question to consider is whether interest rates are sustainable at their current levels or if they are poised to make a significant downward move.
Looking back over a span of 150 years, the median 10-year yield stood at 3.8%. Presently, we find ourselves approximately 115 basis points higher than that historical median. However, it’s important to acknowledge that we are also grappling with one of the most substantial debt-to-GDP challenges in history.
Many investors frequently draw parallels to the 1940s as an analog, which was the only other period when government debt-to-GDP reached levels as extreme as today. Nevertheless, during that decade, interest rates never exceeded 2.5%. With 10-year yields already approaching 5%, the present situation is unfolding in a markedly different manner.
Furthermore, it’s worth noting that the Congressional Budget Office (CBO) recently released a chart illustrating budget deficits remaining at -6% for another decade. However, this projection appears to be based on the assumption that there will be no recessions during that period, which is highly unrealistic.
Using a rule of 72 calculation, a fiscal deficit of this magnitude would result in the doubling of debt within 12 years. This implies adding, in a conservative estimate, an additional $33.6 trillion in Treasury issuances, leaving the possibility of the Federal Reserve stepping in to once again assume its role as the primary financier of government debt.
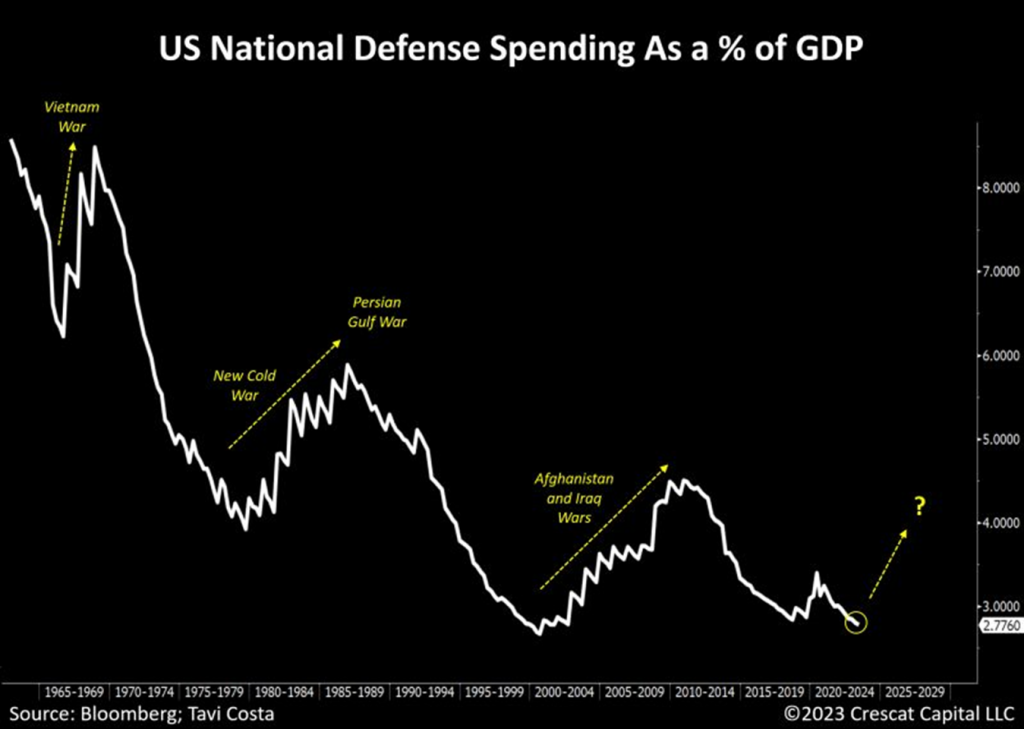
Keep in mind that we are grappling with these issues within the Treasury market and a bloated fiscal agenda, even though defense spending is currently at its lowest historical level. We are presently engaged in two wars, and tensions with China continue to deteriorate.
How long will it be before additional military support is needed, exerting significant pressure on government spending? There are anti-war forces that have prevented us from entering the Ukraine war. Maybe these forces will prevail in the Israeli war. I don’t know that Americans can stomach more spending on more wars.
For logical reasons, defense spending relative to GDP tends to increase significantly during wartime, and this time will probably be no different.
Yield Curve Inversion
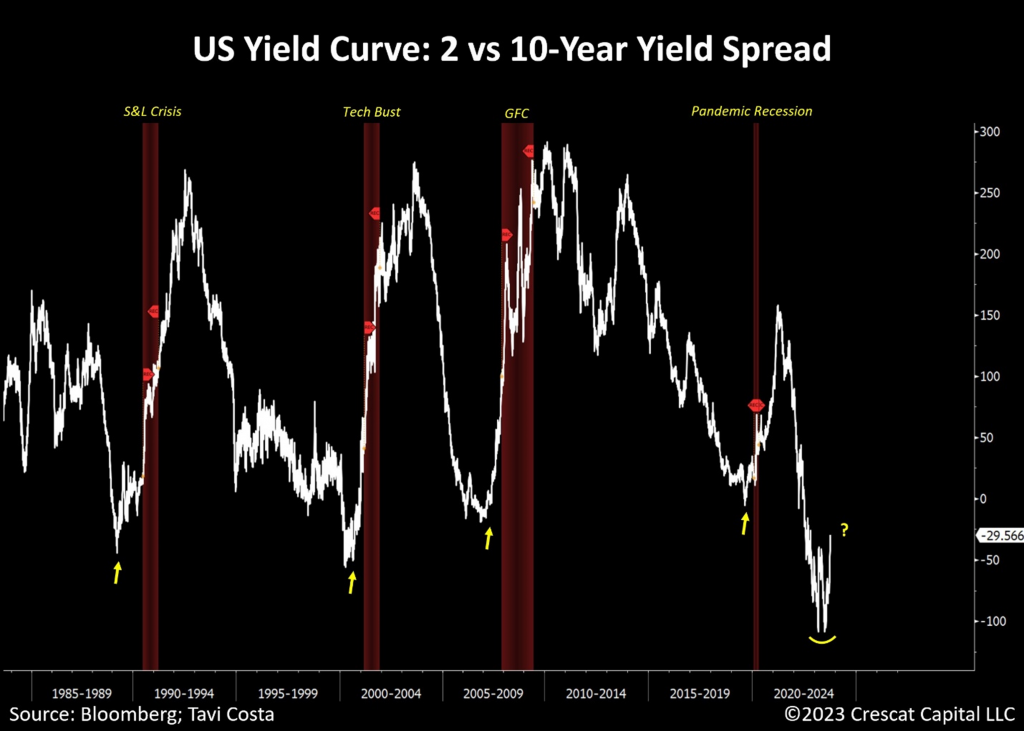
The recent steepening of the yield curve also suggests that unemployment rates are likely to start rising significantly in the next couple of months.
Although the chart below does go back to that period, the current development in the yield curve has unfolded remarkably similar to the 1973-4 during the stagflationary crisis. Back then, we had a deeply inverted curve, across multiple duration spreads, that then subsequently had an un-inverted period despite the Fed being forced to raise rates due to inflationary pressures.
Performance
Performance data represents past performance, and past performance does not guarantee future results. Performance data is subject to revision following each monthly reconciliation and/or annual audit. Historical net returns reflect the performance of an investor who invested from inception and is eligible to participate in new issues. Net returns reflect the reinvestment of dividends and earnings and the deduction of all fees and expenses (including a management fee and incentive allocation, where applicable). Individual performance may be lower or higher than the performance data presented. The performance of Crescat’s private funds may not be directly comparable to the performance of other private or registered funds. The currency used to express performance is U.S. dollars. Investors may obtain the most current performance data and private offering memorandum for Crescat’s private funds by emailing a request to info@crescat.net.
At Crescat we are currently positioned to take advantage of our research outlined above in various different ways across our funds and SMA strategies. We encourage you to reach out to any of us listed below if you would like to learn more about how our vehicles might fit with your individual needs and objectives.
Sincerely,
Kevin C. Smith, CFA
Founder & Chief Investment Officer
ksmith@crescat.net
(303) 228-7374
Tavi Costa
Member & Macro Strategist
tcosta@crescat.net
(303) 228-7375
Quinton T. Hennigh, Ph.D.
Member & Geologic and Technical Director
qhennigh@crescat.net
(720) 938-1945
Marek Iwahashi
Investor Relations Coordinator
miwahashi@crescat.net
(720) 323-2995
Linda Carleu Smith, CPA
Co-Founder & Chief Operating Officer
lsmith@crescat.net
(303) 228-7371
© 2023 Crescat Capital LLC
Important Disclosures
Performance data represents past performance, and past performance does not guarantee future results. An individual investor’s results may vary due to the timing of capital transactions. Performance for all strategies is expressed in U.S. dollars. Cash returns are included in the total account and are not detailed separately. Investment results shown are for taxable and tax-exempt clients and include the reinvestment of dividends, interest, capital gains, and other earnings. Any possible tax liabilities incurred by the taxable accounts have not been reflected in the net performance. Performance is compared to an index, however, the volatility of an index varies greatly and investments cannot be made directly in an index. Market conditions vary from year to year and can result in a decline in market value due to material market or economic conditions. There should be no expectation that any strategy will be profitable or provide a specified return. Case studies are included for informational purposes only and are provided as a general overview of our general investment process, and not as indicative of any investment experience. There is no guarantee that the case studies discussed here are completely representative of our strategies or of the entirety of our investments, and we reserve the right to use or modify some or all of the methodologies mentioned herein.
This presentation is not an offer to sell securities of any investment fund or a solicitation of offers to buy any such securities. Securities of a fund managed by Crescat may be offered to selected qualified investors only by means of a complete offering memorandum and related subscription materials which contain significant additional information about the terms of an investment in the Fund and which supersedes information herein in its entirety. Any decision to invest must be based solely upon the information set forth in the Offering Documents, regardless of any information investors may have been otherwise furnished, and should be made after reviewing such Offering Documents, conducting such investigations as the investor deems necessary and consulting the investor’s own investment, legal, accounting and tax advisors in order to make an independent determination of the suitability and consequences of an investment in the Fund.
Risks of Investment Securities: Diversity in holdings is an important aspect of risk management, and CPM works to maintain a variety of themes and equity types to capitalize on trends and abate risk. CPM invests in a wide range of securities depending on its strategies, as described above, including but not limited to long equities, short equities, mutual funds, ETFs, commodities, commodity futures contracts, currency futures contracts, fixed income futures contracts, private placements, precious metals, and options on equities, bonds and futures contracts. The investment portfolios advised or sub-advised by CPM are not guaranteed by any agency or program of the U.S. or any foreign government or by any other person or entity. The types of securities CPM buys and sells for clients could lose money over any timeframe. CPM’s investment strategies are intended primarily for long-term investors who hold their investments for substantial periods of time. Prospective clients and investors should consider their investment goals, time horizon, and risk tolerance before investing in CPM’s strategies and should not rely on CPM’s strategies as a complete investment program for all of their investable assets. Of note, in cases where CPM pursues an activist investment strategy by way of control or ownership, there may be additional restrictions on resale including, for example, volume limitations on shares sold. When CPM’s private investment funds or SMA strategies invest in the precious metals mining industry, there are particular risks related to changes in the price of gold, silver and platinum group metals. In addition, changing inflation expectations, currency fluctuations, speculation, and industrial, government and global consumer demand; disruptions in the supply chain; rising product and regulatory compliance costs; adverse effects from government and environmental regulation; world events and economic conditions; market, economic and political risks of the countries where precious metals companies are located or do business; thin capitalization and limited product lines, markets, financial resources or personnel; and the possible illiquidity of certain of the securities; each may adversely affect companies engaged in precious metals mining related businesses. Depending on market conditions, precious metals mining companies may dramatically outperform or underperform more traditional equity investments. In addition, as many of CPM’s positions in the precious metals mining industry are made through offshore private placements in reliance on exemption from SEC registration, there may be U.S. and foreign resale restrictions applicable to such securities, including but not limited to, minimum holding periods, which can result in discounts being applied to the valuation of such securities. In addition, the fair value of CPM’s positions in private placements cannot always be determined using readily observable inputs such as market prices, and therefore may require the use of unobservable inputs which can pose unique valuation risks. Furthermore, CPM’s private investment funds and SMA strategies may invest in stocks of companies with smaller market capitalizations. Small- and medium-capitalization companies may be of a less seasoned nature or have securities that may be traded in the over-the-counter market. These “secondary” securities 12 often involve significantly greater risks than the securities of larger, better-known companies. In addition to being subject to the general market risk that stock prices may decline over short or even extended periods, such companies may not be well-known to the investing public, may not have significant institutional ownership and may have cyclical, static or only moderate growth prospects. Additionally, stocks of such companies may be more volatile in price and have lower trading volumes than larger capitalized companies, which results in greater sensitivity of the market price to individual transactions. CPM has broad discretion to alter any of the SMA or private investment fund’s investment strategies without prior approval by, or notice to, CPM clients or fund investors, provided such changes are not material.
Benchmarks
HFRX GLOBAL HEDGE FUND INDEX. The HFRX Global Hedge Fund Index represents a broad universe of hedge funds with the capability to trade a range of asset classes and investment strategies across the global securities markets. The index is weighted based on the distribution of assets in the global hedge fund industry. It is a tradeable index of actual hedge funds. It is a suitable benchmark for the Crescat Global Macro private fund which has also traded in multiple asset classes and applied a multi-disciplinary investment process since inception.
HFRX EQUITY HEDGE INDEX. The HFRX Equity Hedge Index represents an investable index of hedge funds that trade both long and short in global equity securities. Managers of funds in the index employ a wide variety of investment processes. They may be broadly diversified or narrowly focused on specific sectors and can range broadly in terms of levels of net exposure, leverage employed, holding periods, concentrations of market capitalizations and valuation ranges of typical portfolios. It is a suitable benchmark for the Crescat Long/Short private fund, which has also been predominantly composed of long and short global equities since inception.
PHILADELPHIA STOCK EXCHANGE GOLD AND SILVER INDEX. The Philadelphia Stock Exchange Gold and Silver Index is the longest running index of global precious metals mining stocks. It is a diversified, capitalization-weighted index of the leading companies involved in gold and silver mining. It is a suitable benchmark for the Crescat Precious Metals private fund and the Crescat Precious Metals SMA strategy, which have also been predominately composed of precious metals mining companies involved in gold and silver mining since inception.
RUSSELL 1000 INDEX. The Russell 1000 Index is a market-cap weighted index of the 1,000 largest companies in US equity markets. It represents a broad scope of companies across all sectors of the economy. It is a commonly followed index among institutions. This index contains many of the same securities as the S&P 500 but is broader and includes some mid-cap companies. It is a suitable benchmark for the Crescat Large Cap SMA strategy, which has predominantly held and traded similar securities since inception.
S&P 500 INDEX. The S&P 500 Index is perhaps the most followed stock market index. It is considered representative of the U.S. stock market at large. It is a market cap-weighted index of the 500 largest and most liquid companies listed on the NYSE and NASDAQ exchanges. While the companies are U.S. based, most of them have broad global operations. Therefore, the index is representative of the broad global economy. It is a suitable benchmark for the Crescat Global Macro and Crescat Long/Short private funds, and the Large Cap and Precious Metals SMA strategies, which have also traded extensively in large, highly liquid global equities through U.S.-listed securities, and in companies Crescat believes are on track to achieve that status. The S&P 500 Index is also used as a supplemental benchmark for the Crescat Precious Metals private fund and Precious Metals SMA strategy because one of the long-term goals of the precious metals strategy is low correlation to the S&P 500.
References to indices, benchmarks or other measures of relative market performance over a specified period of time are provided for your information only. Reference to an index does not imply that the fund or separately managed account will achieve returns, volatility or other results similar to that index. The composition of an index may not reflect the manner in which a portfolio is constructed in relation to expected or achieved returns, portfolio guidelines, restrictions, sectors, correlations, concentrations, volatility or tracking.
Separately Managed Account (SMA) disclosures: The Crescat Large Cap Composite and Crescat Precious Metals Composite include all accounts that are managed according to those respective strategies over which the manager has full discretion. SMA composite performance results are time-weighted net of all investment management fees and trading costs including commissions and non-recoverable withholding taxes. Investment management fees are described in Crescat’s Form ADV 2A. The manager for the Crescat Large Cap strategy invests predominantly in equities of the top 1,000 U.S. listed stocks weighted by market capitalization. The manager for the Crescat Precious Metals strategy invests predominantly in a global all-cap universe of precious metals mining stocks.
Hedge Fund disclosures: Only accredited investors and qualified clients will be admitted as limited partners to a Crescat hedge fund. For natural persons, investors must meet SEC requirements including minimum annual income or net worth thresholds. Crescat’s hedge funds are being offered in reliance on an exemption from the registration requirements of the Securities Act of 1933 and are not required to comply with specific disclosure requirements that apply to registration under the Securities Act. The SEC has not passed upon the merits of or given its approval to Crescat’s hedge funds, the terms of the offering, or the accuracy or completeness of any offering materials. A registration statement has not been filed for any Crescat hedge fund with the SEC. Limited partner interests in the Crescat hedge funds are subject to legal restrictions on transfer and resale. Investors should not assume they will be able to resell their securities. Investing in securities involves risk. Investors should be able to bear the loss of their investment. Investments in Crescat’s hedge funds are not subject to the protections of the Investment Company Act of 1940. Performance data is subject to revision following each monthly reconciliation and annual audit. Current performance may be lower or higher than the performance data presented. The performance of Crescat’s hedge funds may not be directly comparable to the performance of other private or registered funds. Hedge funds may involve complex tax strategies and there may be delays in distribution tax information to investors.
Investors may obtain the most current performance data, private offering memoranda for Crescat’s hedge funds, and information on Crescat’s SMA strategies, including Form ADV Part II, by contacting Linda Smith at (303) 271-9997 or by sending a request via email to lsmith@crescat.net. See the private offering memorandum for each Crescat hedge fund for complete information and risk factors.
Investors may obtain the most current performance data, private offering memoranda for Crescat’s hedge funds, and information on Crescat’s SMA strategies, including Form ADV Part II, by contacting Linda Smith at (303) 271-9997 or by sending a request via email to lsmith@crescat.net. See the private offering memorandum for each Crescat hedge fund for complete information and risk factors.
